Daniocell
c2cd3 (hematopoietic / vasculature)
C2 domain containing 3 centriole elongation regulator
ZFIN
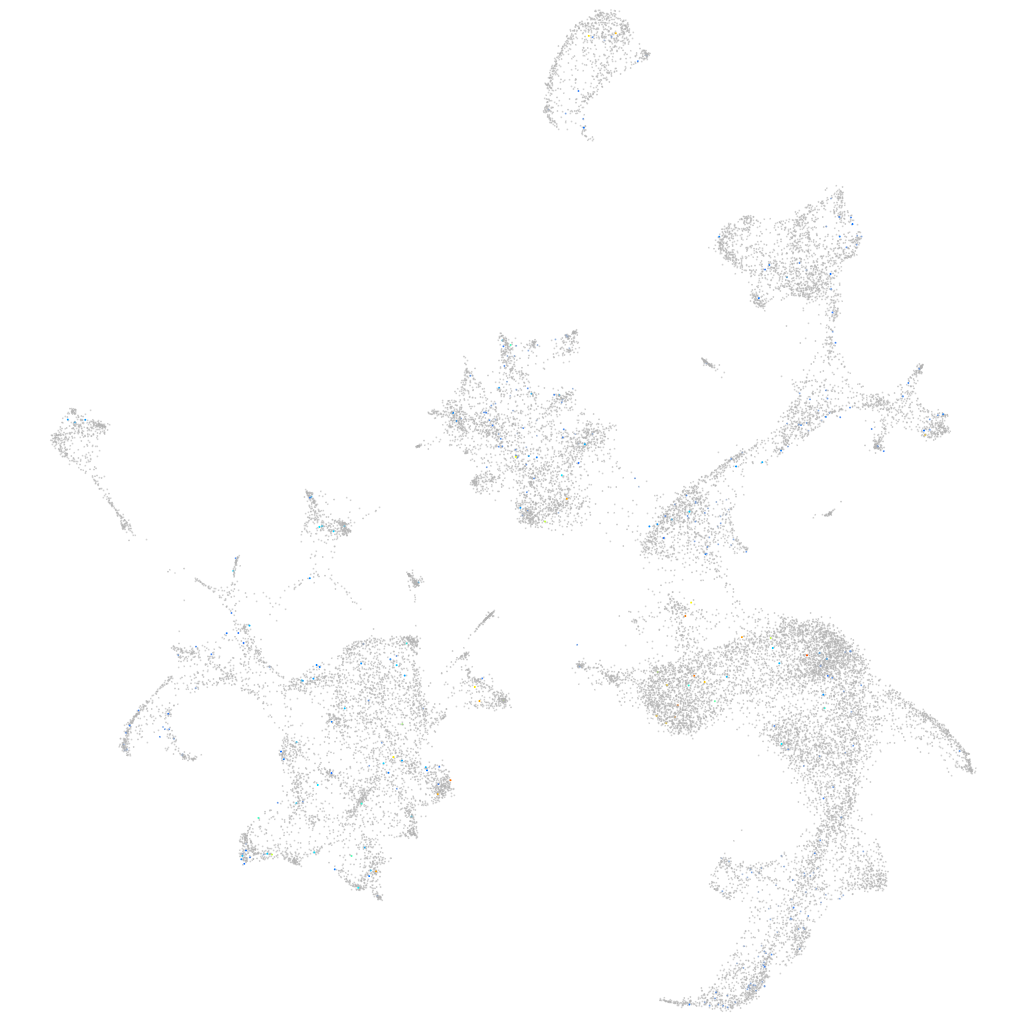
Gene expression UMAP
Display:
Expression
Stage
Other cell groups
all cells
blastomeres
PGCs
endoderm
axial mesoderm
muscle
mural cells /
non-skeletal muscle
mesenchyme
hematopoietic /
vasculature
pronephros
neural
spinal cord / glia
eye
taste / olfactory
otic / lateral line
epidermis
periderm
fin
ionocytes / mucous
pigment cells
Expression by stage/cluster
Correlated gene expression
Positive correlation
Negative correlation
Gene
r
Gene
r
CABZ01057364.2
0.142
zgc:163057
-0.025
LO018422.1
0.129
mcl1a
-0.022
XLOC-022924
0.118
plac8l1
-0.021
XLOC-003642
0.118
cfap36
-0.018
CU856423.1
0.114
selenoj
-0.018
LOC110439506
0.112
gpx1a
-0.017
si:ch211-281p14.2
0.103
prdx2
-0.017
si:dkey-78l4.13
0.101
hemgn
-0.017
CABZ01092907.1
0.101
metap2b
-0.016
FO834800.1
0.100
blvrb
-0.016
tmem174
0.089
alas2
-0.016
CABZ01059392.1
0.088
tdh
-0.015
hdhd5
0.082
eif3hb
-0.015
LOC110439992
0.081
tmod4
-0.014
LOC110437769
0.079
ucp3
-0.014
gucy2f
0.076
hagh
-0.014
popdc3
0.074
hbbe1.2
-0.014
XLOC-026920
0.073
hbbe3
-0.014
styxl1
0.072
apoc1
-0.013
ankk1
0.071
hbbe1.3
-0.013
LOC100005266
0.066
cahz
-0.013
si:ch211-244e12.7
0.065
aldoab
-0.013
fbxo38
0.065
ccdc28a
-0.013
LOC103910314
0.065
ccl34b.1
-0.013
LOC110438359
0.061
pik3ip1
-0.013
LOC101886997
0.060
nlk2
-0.012
CR749164.1
0.060
fthl31
-0.012
noxo1a
0.059
tspo
-0.012
or125-2
0.059
arhgdig
-0.012
gramd1bb
0.057
rbck1
-0.012
capn3b
0.056
hbae1.1
-0.012
LOC108183436
0.055
hprt1l
-0.012
XLOC-008086
0.055
caspa
-0.012
kcnj9
0.054
hbae3
-0.012
gls2a
0.054
glo1
-0.012