Daniocell
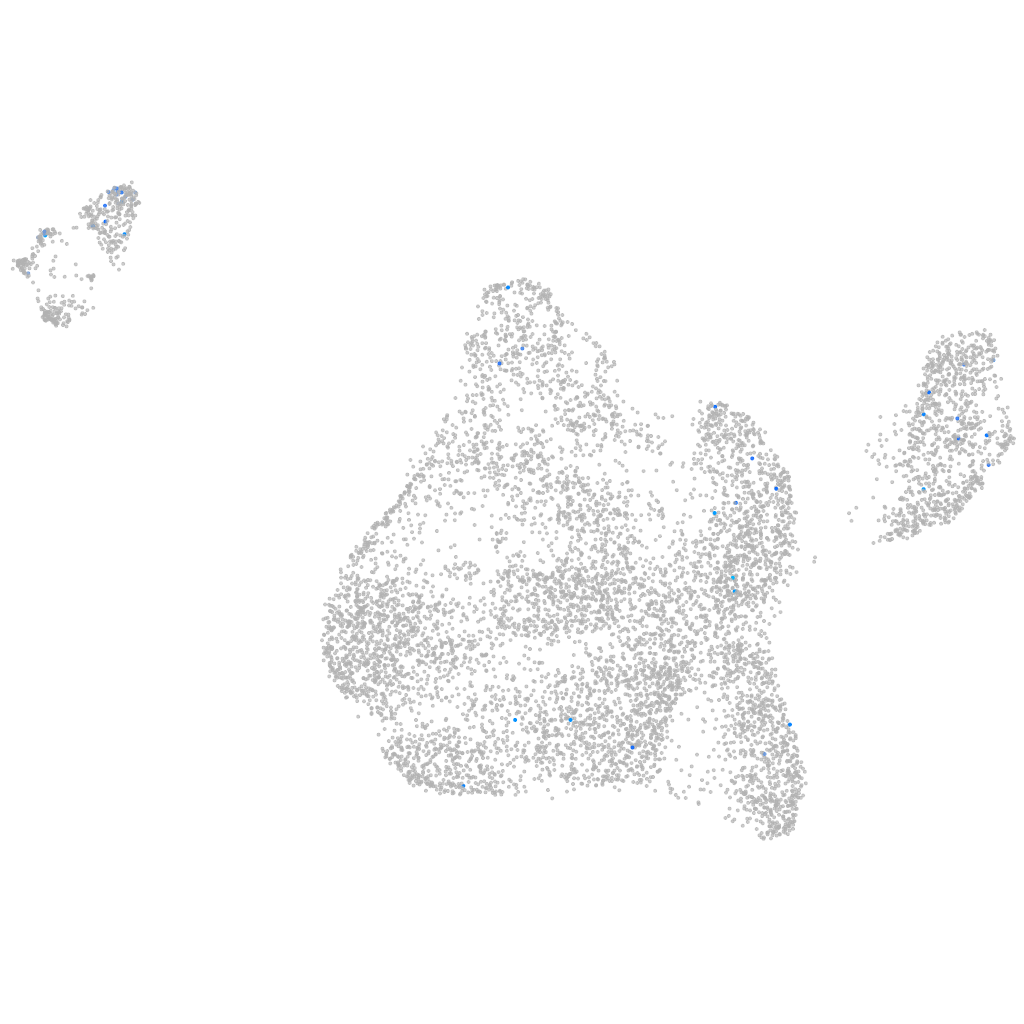
c1qtnf4 (blastomeres)
C1q and TNF related 4
ZFIN
Gene expression UMAP
Display:
Expression
Stage
Other cell groups
all cells
blastomeres
PGCs
endoderm
axial mesoderm
muscle
mural cells /
non-skeletal muscle
mesenchyme
hematopoietic /
vasculature
pronephros
neural
spinal cord / glia
eye
taste / olfactory
otic / lateral line
epidermis
periderm
fin
ionocytes / mucous
pigment cells
Expression by stage/cluster
Correlated gene expression
Positive correlation
Negative correlation
Gene
r
Gene
r
si:dkeyp-80d11.10
0.204
si:ch73-1a9.3
-0.085
kcnj2b
0.192
eef1a1l1
-0.081
CABZ01079480.1
0.188
marcksl1b
-0.081
LOC101884990
0.185
stm
-0.079
scpp9
0.166
si:ch211-152c2.3
-0.077
XLOC-022081
0.165
hspb1
-0.077
si:ch211-147g22.7
0.150
hmgb2a
-0.075
si:ch211-271d10.2
0.149
dynll1
-0.074
CABZ01038699.1
0.147
hnrnpa0b
-0.072
BX323807.1
0.146
si:dkey-151g10.6
-0.072
hspb11
0.140
aldob
-0.071
si:dkey-238o14.1
0.133
anp32e
-0.070
prodhb
0.131
hmgn6
-0.068
sept5b
0.130
polr3gla
-0.067
ponzr6
0.128
snrpd1
-0.064
AL954317.1
0.126
si:ch211-222l21.1
-0.064
si:ch211-196h24.1
0.125
hmga1a
-0.063
diras1a
0.121
rps7
-0.063
LOC100536716
0.119
rps6
-0.062
adgrg7.1
0.115
ptmab
-0.062
BX323830.1
0.115
si:dkey-56m19.5
-0.059
oxt
0.115
rpl27
-0.059
rhd
0.115
cirbpb
-0.059
si:dkeyp-80c12.5
0.113
ncl
-0.058
LOC101882334
0.111
rplp0
-0.058
traf5
0.109
rps21
-0.057
emp2
0.108
si:ch1073-80i24.3
-0.057
LOC100537317
0.107
rpl30
-0.057
XLOC-011941
0.106
rps15a
-0.056
CR354556.3
0.106
rpl26
-0.055
f11r.2
0.105
srsf5a
-0.055
tox2
0.104
npm1a
-0.055
pxdc1b
0.104
rpsa
-0.055
osbpl3a
0.102
si:dkey-239h2.3
-0.054
nt5c1aa
0.102
rps20
-0.053