Daniocell
becn1 (pronephros)
"beclin 1, autophagy related"
ZFIN
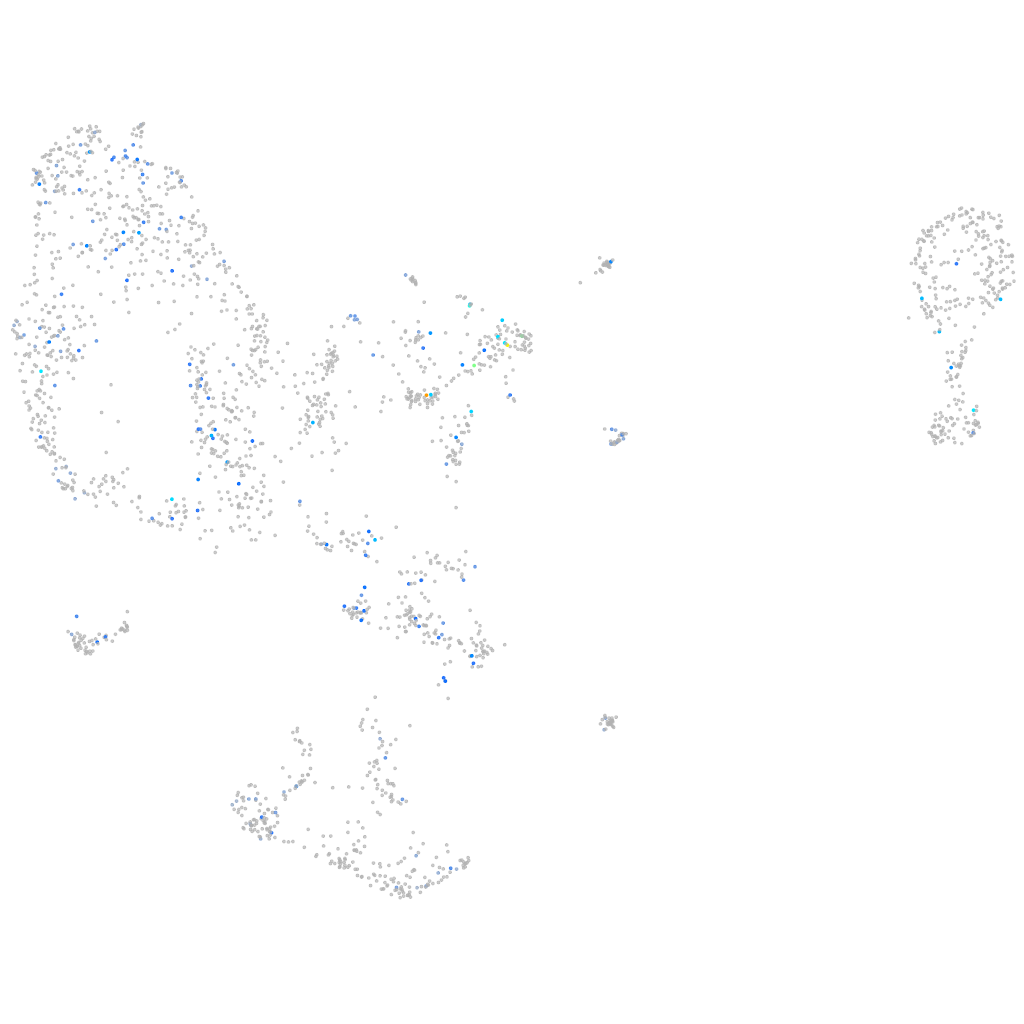
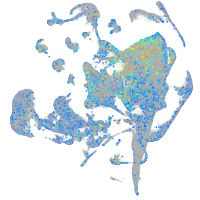
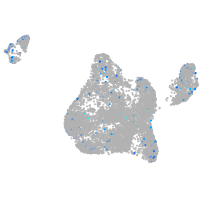
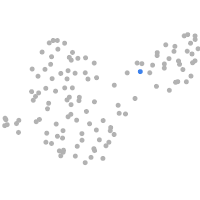
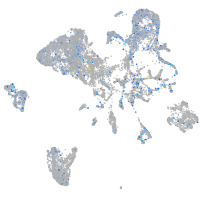
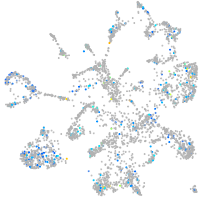
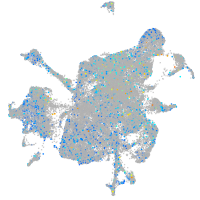
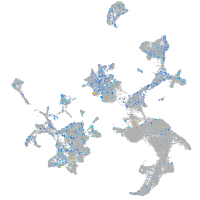
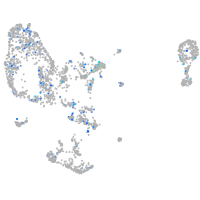
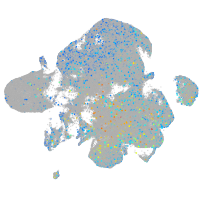
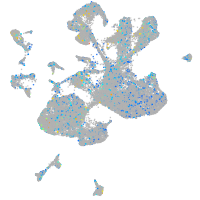
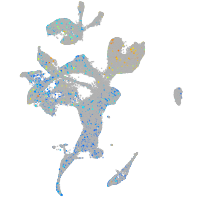
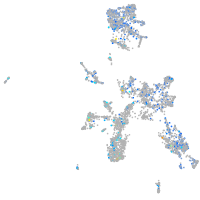
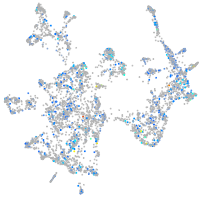
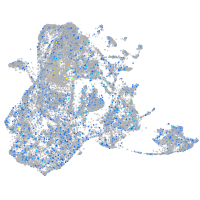
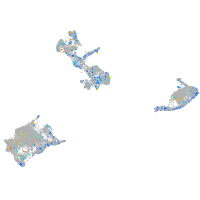
Gene expression UMAP
Display:
Expression
Stage
Other cell groups
all cells
blastomeres
PGCs
endoderm
axial mesoderm
muscle
mural cells /
non-skeletal muscle
mesenchyme
hematopoietic /
vasculature
pronephros
neural
spinal cord / glia
eye
taste / olfactory
otic / lateral line
epidermis
periderm
fin
ionocytes / mucous
pigment cells
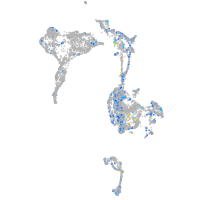
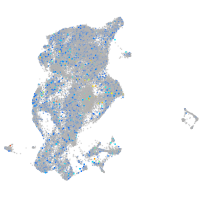
Expression by stage/cluster
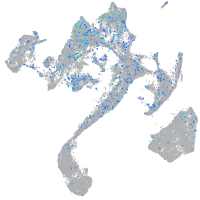
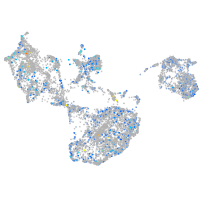
Correlated gene expression
Positive correlation
Negative correlation
Gene
r
Gene
r
CR450727.1
0.256
rps28
-0.099
gpr75
0.252
rpl29
-0.088
ppef1
0.241
rpl5b
-0.065
BX284697.2
0.217
rpl6
-0.064
LOC108180041
0.216
acads
-0.063
LOC110438345
0.216
NC-002333.4
-0.060
si:dkeyp-41f9.4
0.212
rrp8
-0.058
cyp1b1
0.210
nradd
-0.054
tspan2a
0.207
cxcl12a
-0.053
hivep2b
0.197
apoc1
-0.053
si:ch211-196f2.3
0.192
uqcr10
-0.052
tmem176l.3b
0.190
gna13b
-0.052
malrd1
0.186
wu:fb97g03
-0.052
BX539336.1
0.186
hook1
-0.051
sult1st5
0.183
mphosph6
-0.051
si:ch211-215p11.1
0.182
dnajc2
-0.050
adora1b
0.179
ncoa2
-0.050
hmcn1
0.178
blnk
-0.049
XLOC-007664
0.178
nop14
-0.049
dnajb4
0.177
si:dkey-261j4.5
-0.049
pcdh1g22
0.176
cdx4
-0.048
zgc:113984.1
0.175
slc43a1a
-0.048
cyp8b1
0.174
trim35-12
-0.048
soga3b
0.174
si:dkey-36i7.3
-0.048
jakmip2
0.173
BX927327.1
-0.047
tmem151a
0.173
ISCU
-0.047
adra2c
0.172
casp3a
-0.047
rprm3
0.171
rbms1a
-0.046
si:dkey-95h12.1
0.170
isy1
-0.045
gpr85
0.170
BX957362.1
-0.045
rs1a
0.170
rnf114
-0.045
si:ch211-103a14.5
0.169
ap1s3a
-0.045
elmod3
0.169
eva1a
-0.045
CABZ01117752.1
0.168
pes
-0.044
mmp13a
0.167
ing5b
-0.044