Daniocell
baalca (muscle)
BAALC binder of MAP3K1 and KLF4 a
ZFIN
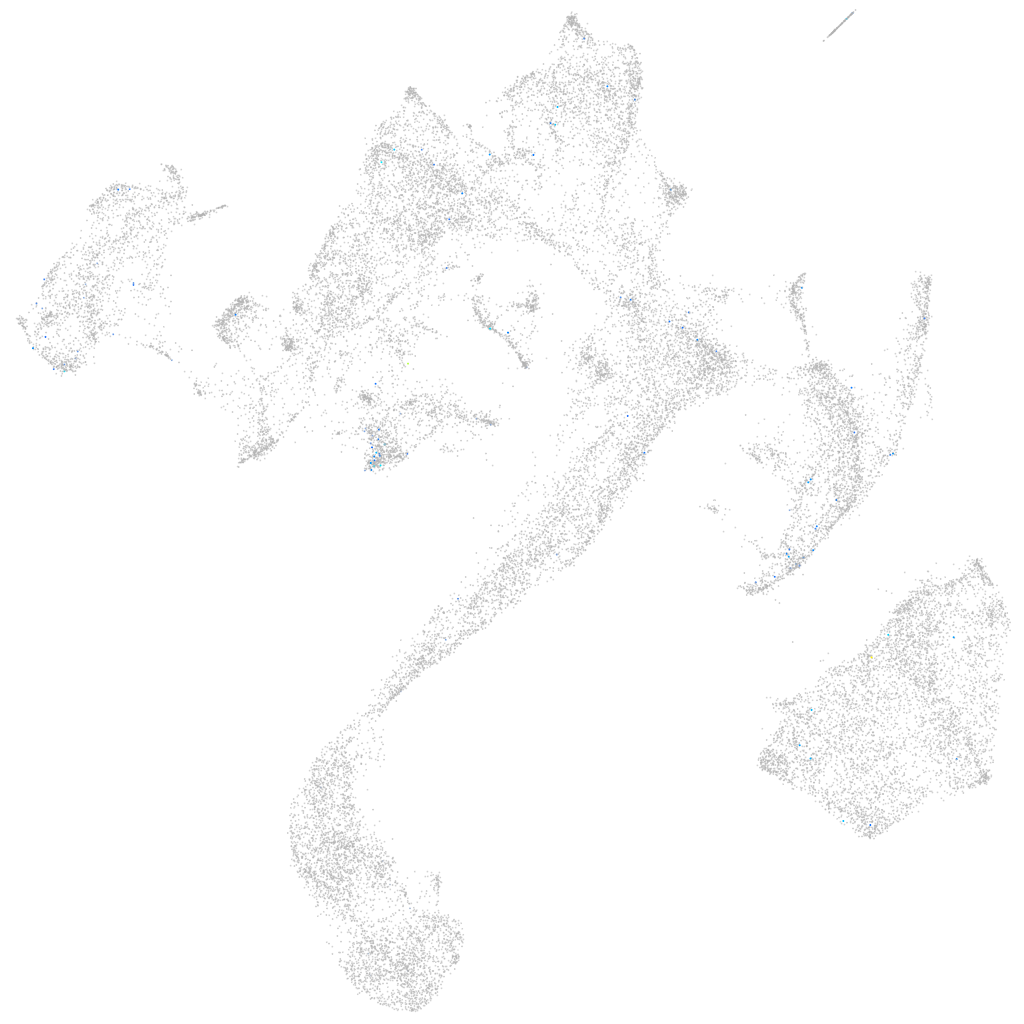
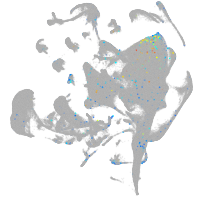
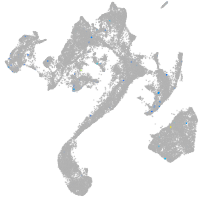
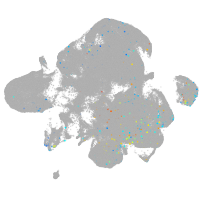
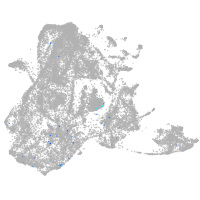
Gene expression UMAP
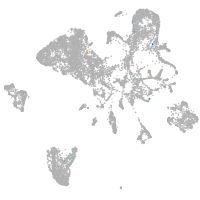
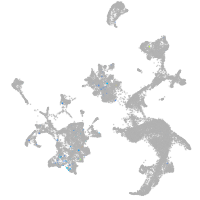
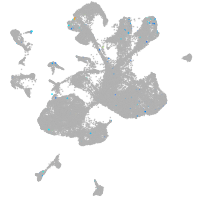
Display:
Expression
Stage
Other cell groups
all cells
blastomeres
PGCs
endoderm
axial mesoderm
muscle
mural cells /
non-skeletal muscle
mesenchyme
hematopoietic /
vasculature
pronephros
neural
spinal cord / glia
eye
taste / olfactory
otic / lateral line
epidermis
periderm
fin
ionocytes / mucous
pigment cells
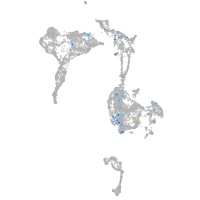
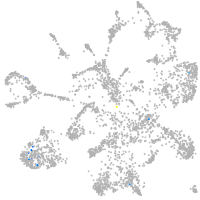
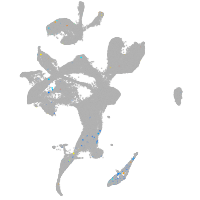
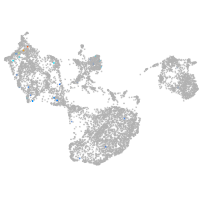
Expression by stage/cluster
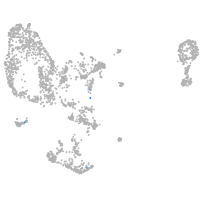
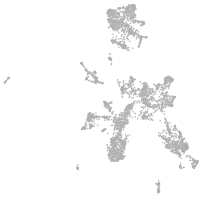
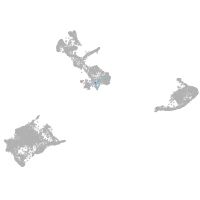
Correlated gene expression
Positive correlation
Negative correlation
Gene
r
Gene
r
LOC108181455
0.171
si:dkey-151g10.6
-0.028
CR628341.1
0.157
gatm
-0.025
shisa7a
0.150
rpl29
-0.024
trpc5a
0.144
rps28
-0.023
si:dkey-254e13.6
0.118
tnni2b.1
-0.022
lrrtm4l2
0.116
rps20
-0.022
CT027583.2
0.116
hsp90aa1.1
-0.021
CABZ01012957.1
0.112
zgc:92429
-0.021
XLOC-028531
0.111
zgc:101853
-0.020
arrb1
0.107
myl1
-0.020
si:dkey-27j5.5
0.103
smyd1b
-0.019
nitr1b
0.097
rps12
-0.019
LOC100005187
0.097
mylpfa
-0.019
LOC110437748
0.097
rps26l
-0.019
LOC110438075
0.097
rps29
-0.019
CABZ01015105.1
0.094
mybphb
-0.018
si:ch211-191a16.5
0.090
klhl41b
-0.018
BX901883.2
0.087
fxr2
-0.018
LOC101882982
0.082
mylz3
-0.018
or119-2
0.082
mak16
-0.018
rims2a
0.081
ccdc43
-0.017
carmil2
0.080
lrrc20
-0.017
si:ch211-233h19.2
0.079
egfl6
-0.017
syt11a
0.079
myog
-0.017
zgc:171310
0.078
rpl3
-0.016
FOXN2
0.077
tpma
-0.016
celf5a
0.077
si:dkey-239h2.3
-0.016
rtn1b
0.076
rplp1
-0.016
FP325112.1
0.076
rpl38
-0.016
scg2b
0.075
surf6
-0.016
XLOC-022611
0.075
nifk
-0.016
vip
0.074
myoz1b
-0.016
mturn
0.074
polr3h
-0.016
syt1a
0.074
rrp12
-0.016
btbd3b
0.073
nexn
-0.016