Daniocell
atpaf2 (blastomeres)
ATP synthase mitochondrial F1 complex assembly factor 2
ZFIN
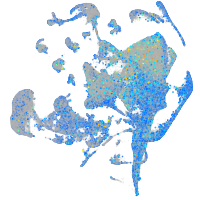
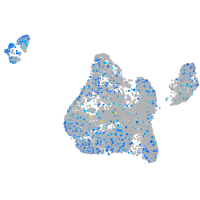
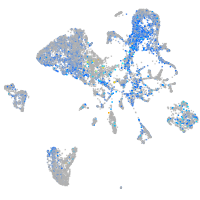
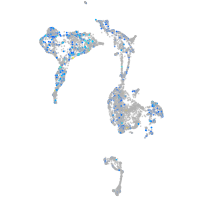
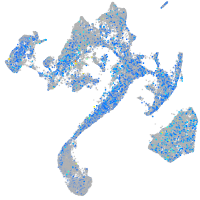
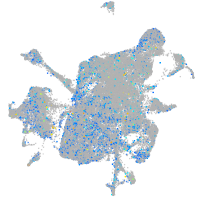
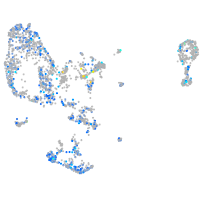
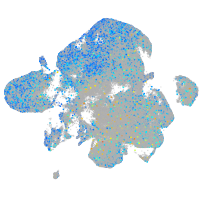
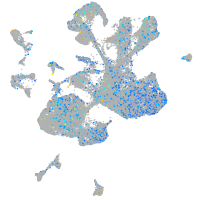
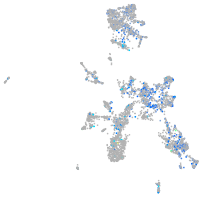
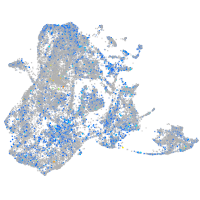
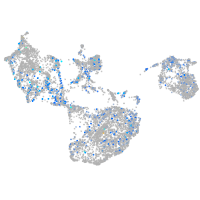
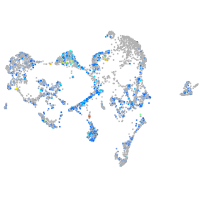
Gene expression UMAP
Display:
Expression
Stage
Other cell groups
all cells
blastomeres
PGCs
endoderm
axial mesoderm
muscle
mural cells /
non-skeletal muscle
mesenchyme
hematopoietic /
vasculature
pronephros
neural
spinal cord / glia
eye
taste / olfactory
otic / lateral line
epidermis
periderm
fin
ionocytes / mucous
pigment cells
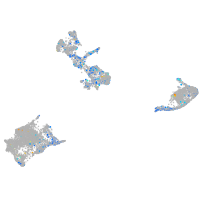
Expression by stage/cluster
Correlated gene expression
Positive correlation
Negative correlation
Gene
r
Gene
r
btg4
0.140
si:ch73-1a9.3
-0.137
cldnd
0.129
marcksl1b
-0.136
si:ch211-132b12.8
0.129
stm
-0.133
buc2l
0.129
hspb1
-0.127
si:ch211-147a11.3
0.129
hnrnpa0b
-0.127
mid1ip1l
0.128
hmgb2a
-0.120
ctss2.1
0.126
hmgn6
-0.112
h2af1al
0.126
hmga1a
-0.108
ca15b
0.125
si:ch211-222l21.1
-0.105
mknk2a
0.125
dynll1
-0.099
zgc:113424
0.125
NC-002333.4
-0.093
arl4aa
0.124
si:ch211-152c2.3
-0.090
fbxo32
0.122
ptmab
-0.090
cldng
0.122
aldob
-0.088
ccnb2
0.120
si:dkey-151g10.6
-0.087
ell
0.120
polr3gla
-0.086
fam129bb
0.120
anp32a
-0.085
si:ch211-266i6.3
0.119
srsf5a
-0.080
ska2
0.117
eef1a1l1
-0.078
tmem131
0.117
ybx1
-0.077
gstm.1
0.117
hmgn7
-0.077
si:dkey-208k4.2
0.117
si:ch73-281n10.2
-0.075
pabpn1l
0.117
si:dkey-56m19.5
-0.075
buc
0.116
rplp1
-0.075
si:ch211-145c1.1
0.115
cirbpb
-0.074
fbxo45
0.114
akap12b
-0.070
fam114a2
0.114
npm1a
-0.068
slbp2
0.113
si:ch1073-80i24.3
-0.067
uchl1
0.113
CR383676.1
-0.067
sinup
0.113
rps12
-0.065
lsm14b
0.113
hmgb2b
-0.065
yipf1
0.112
khdrbs1a
-0.063
fam49bb
0.112
apoeb
-0.060
ccdc50
0.112
naca
-0.059
zgc:162879
0.111
rpl32
-0.059