Daniocell
atp6v0a2a (endoderm)
ATPase H+ transporting V0 subunit a2a
ZFIN
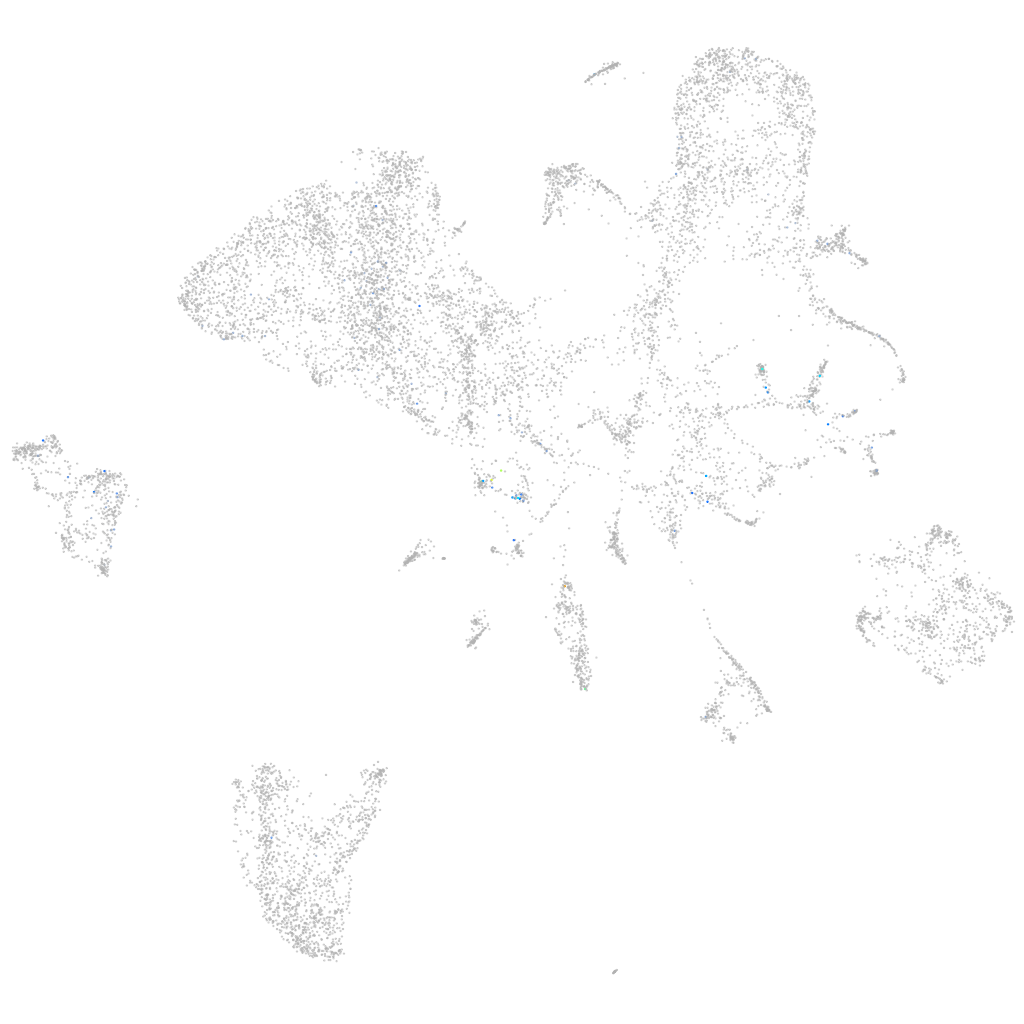
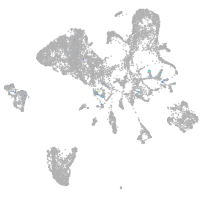
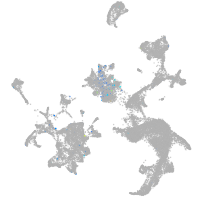
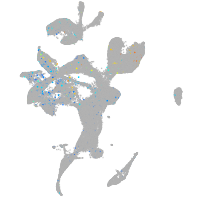
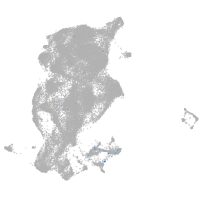
Gene expression UMAP
Display:
Expression
Stage
Other cell groups
all cells
blastomeres
PGCs
endoderm
axial mesoderm
muscle
mural cells /
non-skeletal muscle
mesenchyme
hematopoietic /
vasculature
pronephros
neural
spinal cord / glia
eye
taste / olfactory
otic / lateral line
epidermis
periderm
fin
ionocytes / mucous
pigment cells
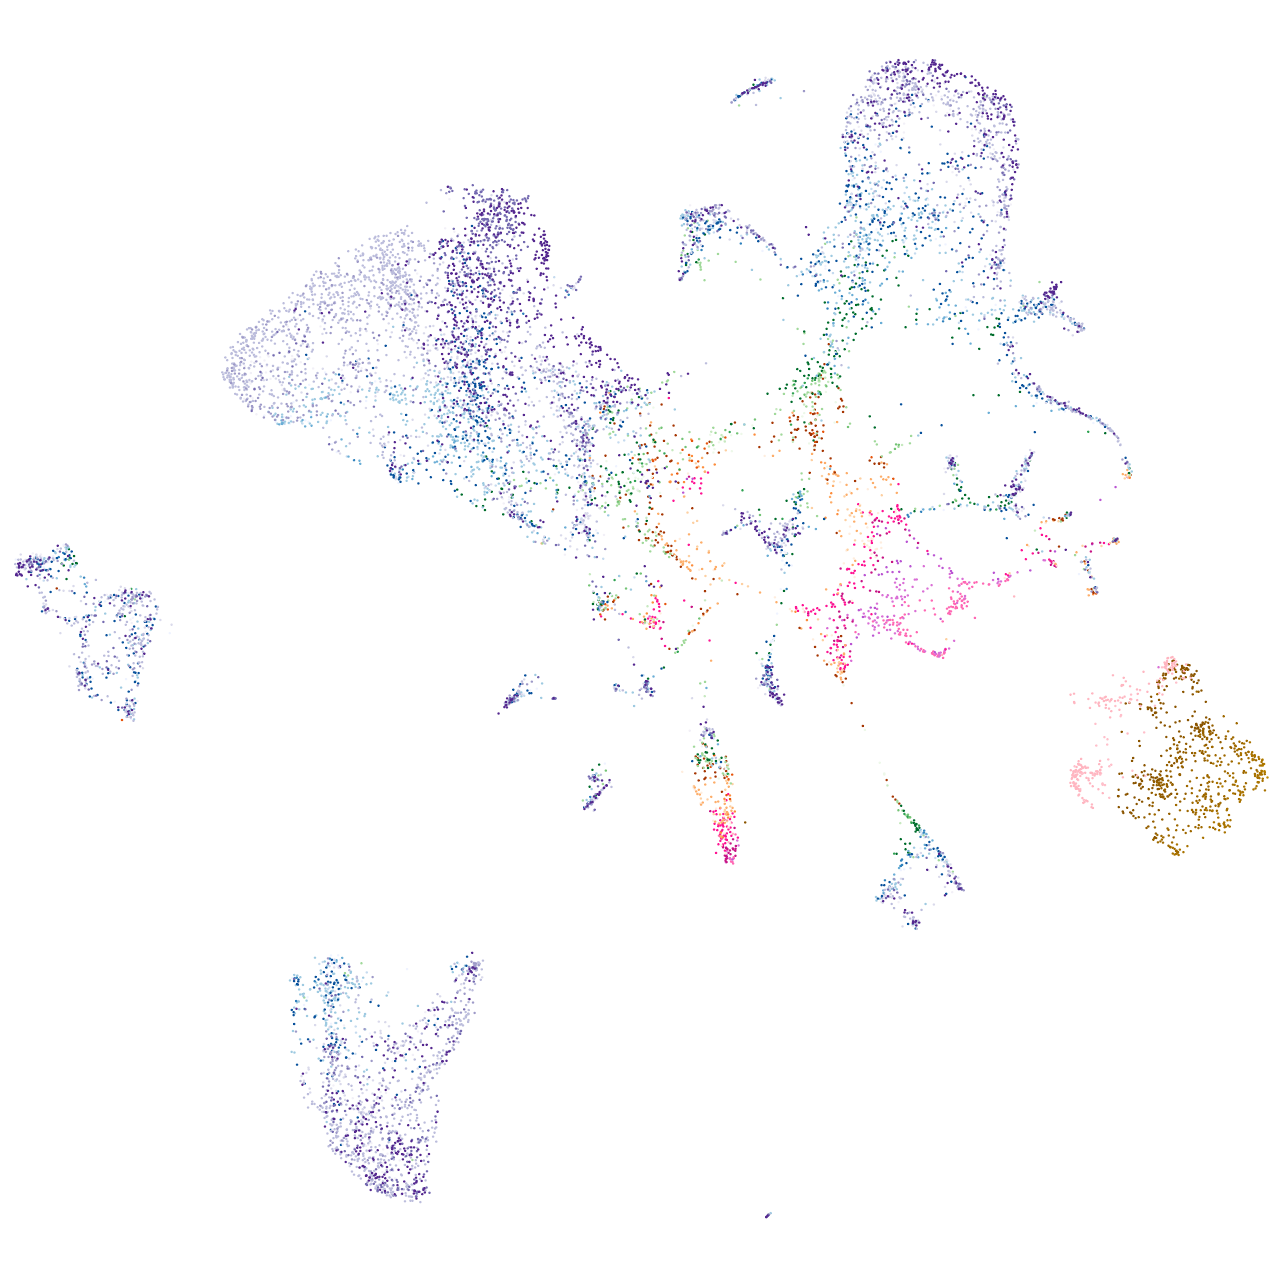
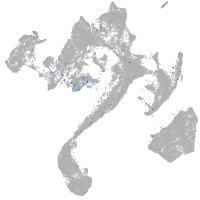
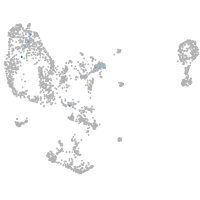
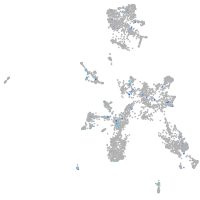
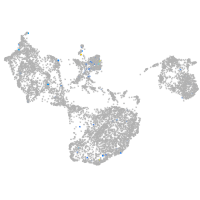
Expression by stage/cluster
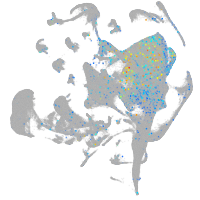
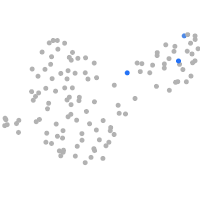
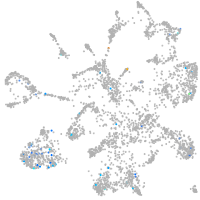
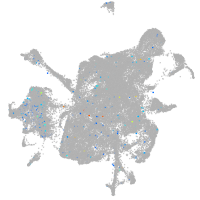
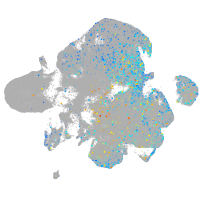
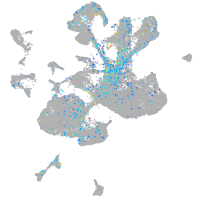
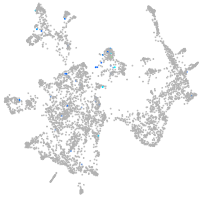
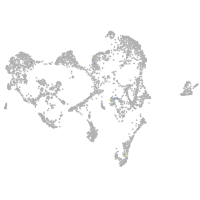
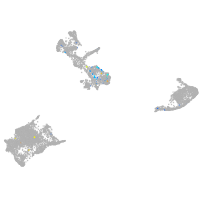
Correlated gene expression
Positive correlation
Negative correlation
Gene
r
Gene
r
LOC110438488
0.377
gapdh
-0.038
LOC100000365
0.354
glud1b
-0.036
wu:fd46c06
0.328
ssr1
-0.036
LOC103909675
0.285
sdr16c5b
-0.034
LOC110438274
0.281
gstt1a
-0.033
BX927216.1
0.273
cox7a1
-0.033
si:dkey-183p4.10
0.273
eef1da
-0.032
PRMT8
0.237
wu:fj16a03
-0.031
si:dkey-90l8.3
0.237
rpl3
-0.031
zgc:174354
0.233
gamt
-0.031
LOC101885158
0.214
mt-nd5
-0.031
LOC110440218
0.202
fbp1b
-0.030
LOC103911631
0.197
cox8b
-0.029
mc5rb
0.178
spink4
-0.029
asb16
0.176
atp1b1a
-0.029
inavaa
0.172
hdlbpa
-0.029
isl2b
0.164
alas1
-0.028
LOC110438054
0.164
sar1b
-0.027
slc22a4
0.163
ndufa6
-0.027
XLOC-024824
0.162
sult2st2
-0.027
LOC110437921
0.161
aldh7a1
-0.027
aatkb
0.156
aldh9a1a.1
-0.027
FP102969.1
0.153
eno3
-0.027
tcf4
0.152
cox6a1
-0.027
si:ch211-57n23.4
0.150
ndrg1a
-0.027
FO904868.1
0.149
cx32.3
-0.026
rapgefl1
0.148
sod1
-0.026
tmem151bb
0.147
CABZ01032488.1
-0.025
kif26bb
0.143
ugt1a7
-0.025
si:ch73-21g5.7
0.143
sult1st6
-0.025
FP325112.2
0.142
ppdpfa
-0.025
XLOC-031098
0.142
si:dkey-16p21.8
-0.025
LOC101884985
0.140
rps18
-0.025
si:ch211-191i18.2
0.139
gsta.1
-0.025
LOC100334422
0.137
cyp2n13
-0.025