Daniocell
atg9a (fin)
ATG9 autophagy related 9 homolog A (S. cerevisiae)
ZFIN
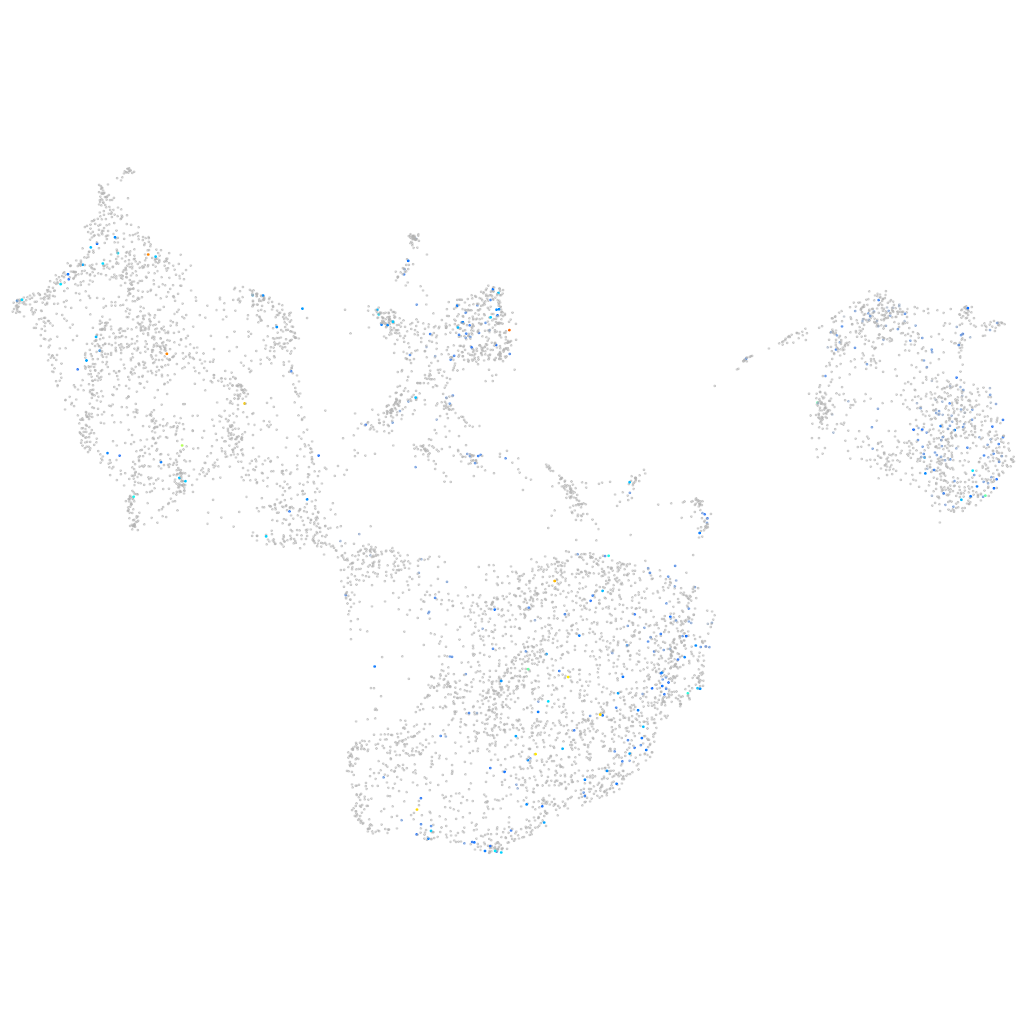
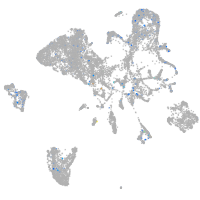
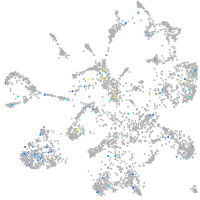
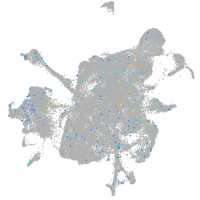
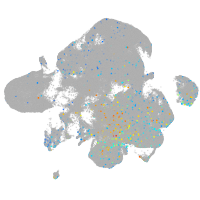
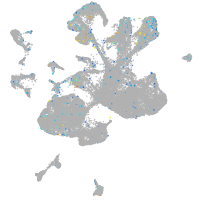
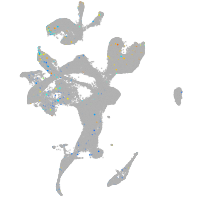
Gene expression UMAP
Display:
Expression
Stage
Other cell groups
all cells
blastomeres
PGCs
endoderm
axial mesoderm
muscle
mural cells /
non-skeletal muscle
mesenchyme
hematopoietic /
vasculature
pronephros
neural
spinal cord / glia
eye
taste / olfactory
otic / lateral line
epidermis
periderm
fin
ionocytes / mucous
pigment cells
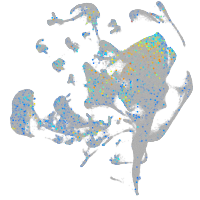
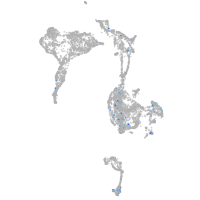
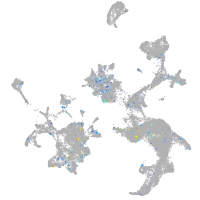
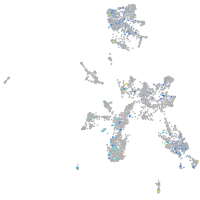
Expression by stage/cluster
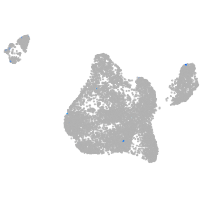
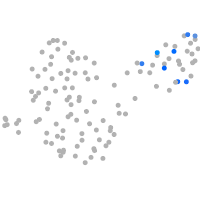
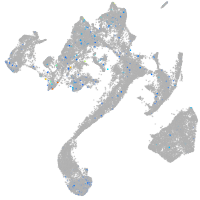
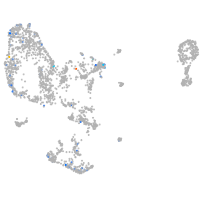
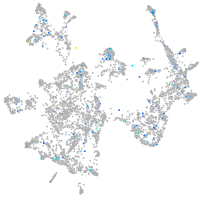
Correlated gene expression
Positive correlation
Negative correlation
Gene
r
Gene
r
tacr3l
0.213
h2afvb
-0.067
ptk6b
0.186
rps20
-0.063
cacna1ea
0.179
rpl10a
-0.062
si:dkey-225f23.5
0.167
hmgn6
-0.060
ctxn2
0.165
hmga1a
-0.058
si:rp71-17i16.6
0.163
fkbp9
-0.058
rapgef6
0.159
snrpg
-0.058
si:ch73-364h19.2
0.159
selenom
-0.058
MTERF1
0.157
si:dkey-151g10.6
-0.058
XLOC-029634
0.156
rpsa
-0.058
si:dkey-103g5.4
0.154
rpn1
-0.058
si:dkey-7n6.2
0.145
kdelr2b
-0.057
GPR139
0.143
rps21
-0.056
lmx1a
0.140
ppib
-0.056
BX537103.1
0.140
rpl38
-0.054
cngb3.1
0.139
rplp1
-0.054
gabbr1a
0.136
rps2
-0.053
CABZ01102201.1
0.136
serpinh1b
-0.052
kcnh3
0.135
ostc
-0.052
LOC101882358
0.134
ost4
-0.052
CNNM1
0.133
rplp2l
-0.052
si:cabz01074946.1
0.132
hmgn2
-0.051
cpne4b
0.131
rpl22l1
-0.050
mmel1
0.131
tram1
-0.050
si:dkey-53k12.1
0.129
tars
-0.050
LOC108182766
0.125
rps25
-0.050
pik3r6a
0.123
rpl36
-0.048
cacna1ha
0.122
rpl27a
-0.048
XLOC-030786
0.120
si:ch73-1a9.3
-0.048
RF00421
0.119
rps12
-0.048
gng8
0.119
rpl23
-0.048
si:ch73-215d9.1
0.118
golt1bb
-0.047
ptprn2
0.118
psat1
-0.047
fgf13b
0.115
dad1
-0.047
CABZ01079080.1
0.115
asph
-0.047