Daniocell
atf7ip2 (fin)
activating transcription factor 7 interacting protein 2
ZFIN
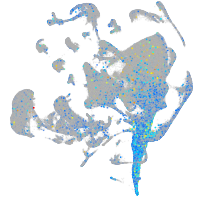
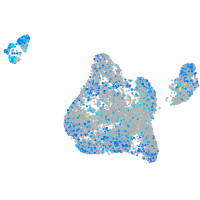
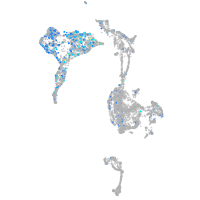
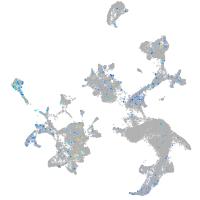
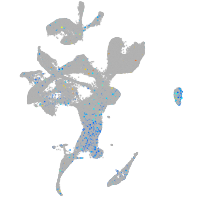
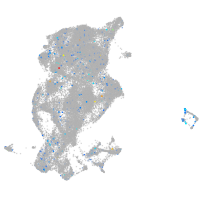
Gene expression UMAP
Display:
Expression
Stage
Other cell groups
all cells
blastomeres
PGCs
endoderm
axial mesoderm
muscle
mural cells /
non-skeletal muscle
mesenchyme
hematopoietic /
vasculature
pronephros
neural
spinal cord / glia
eye
taste / olfactory
otic / lateral line
epidermis
periderm
fin
ionocytes / mucous
pigment cells
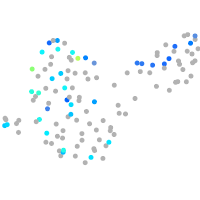
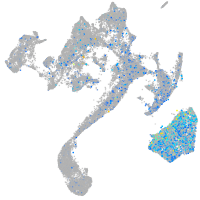
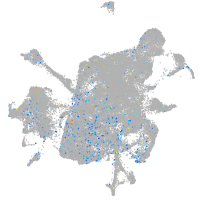
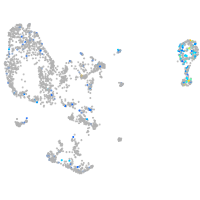
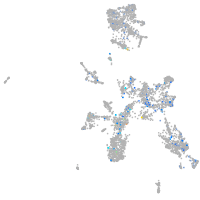
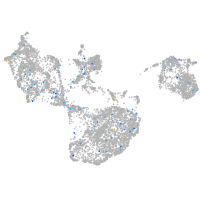
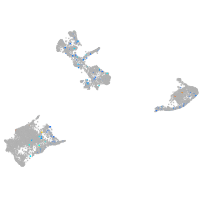
Expression by stage/cluster
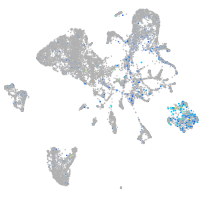
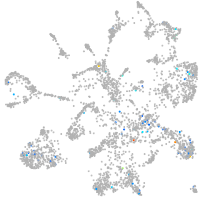
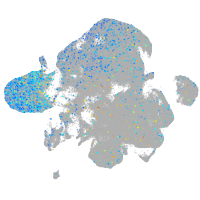
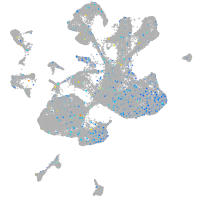
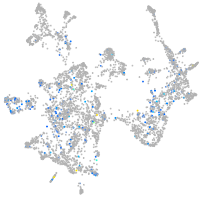
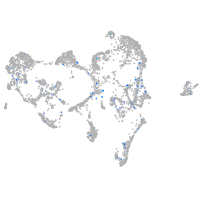
Correlated gene expression
Positive correlation
Negative correlation
Gene
r
Gene
r
abcg2b
0.229
tp63
-0.052
klhl30
0.197
arhgef5
-0.052
XLOC-029676
0.194
cldn1
-0.050
cnr1
0.160
si:dkey-248g15.3
-0.048
gpr155b
0.155
s100a10b
-0.047
si:dkey-33c14.6
0.151
klf6a
-0.045
plppr4a
0.144
cyt1
-0.045
CU467639.1
0.139
pfn1
-0.044
plxnc1
0.138
cfl1l
-0.044
BX511272.1
0.135
icn
-0.044
si:busm1-52i16.2
0.135
tmsb1
-0.044
frem1b
0.132
tmsb4x
-0.043
LOC110438072
0.128
arpc3
-0.043
LOC100333031
0.127
capns1a
-0.042
pnrc1
0.125
hbegfa
-0.042
si:ch73-158p21.2
0.122
arpc5b
-0.041
LOC100535772
0.122
anxa1a
-0.041
camkk1b
0.122
cast
-0.041
CR456642.1
0.121
bmp2b
-0.040
LOC101883647
0.120
actb2
-0.039
XLOC-042514
0.118
cotl1
-0.039
XLOC-019674
0.118
arl4ca
-0.039
BX649485.2
0.118
cldni
-0.038
ecel1
0.116
sh3gl1a
-0.038
CR391963.1
0.115
f11r.1
-0.038
ttc7a
0.114
si:ch1073-406l10.2
-0.038
LOC108190625
0.113
bcam
-0.038
si:ch211-236p5.2
0.112
epcam
-0.038
BX511021.1
0.112
dap1b
-0.038
fbxw9
0.111
wu:fb18f06
-0.037
LRP4
0.111
ak1
-0.037
AL929171.1
0.109
dlx3b
-0.037
zgc:113425
0.109
capns1b
-0.037
BX649416.2
0.107
si:dkey-102c8.3
-0.037
BX890629.1
0.106
tmem54a
-0.037