Daniocell
asic1c (fin)
acid-sensing (proton-gated) ion channel 1c
ZFIN
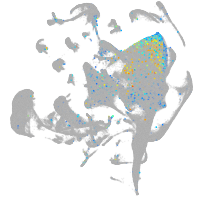
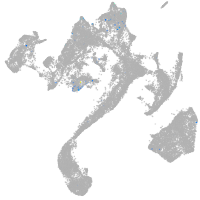
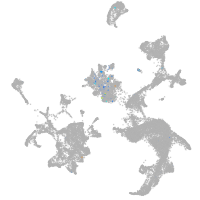
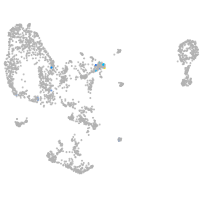
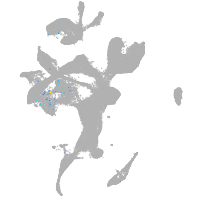
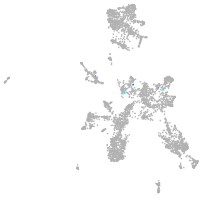
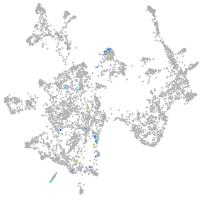
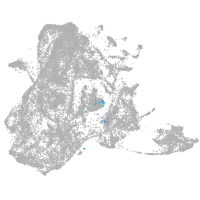
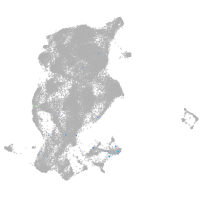
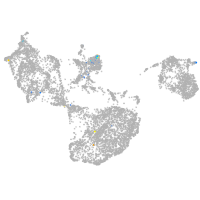
Gene expression UMAP
Display:
Expression
Stage
Other cell groups
all cells
blastomeres
PGCs
endoderm
axial mesoderm
muscle
mural cells /
non-skeletal muscle
mesenchyme
hematopoietic /
vasculature
pronephros
neural
spinal cord / glia
eye
taste / olfactory
otic / lateral line
epidermis
periderm
fin
ionocytes / mucous
pigment cells
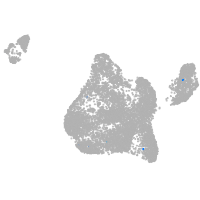
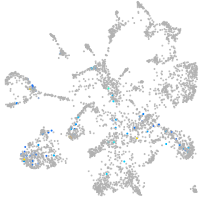
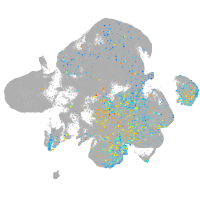
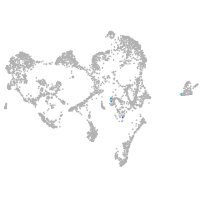
Expression by stage/cluster
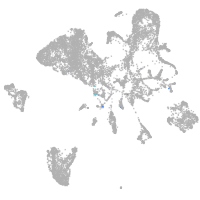
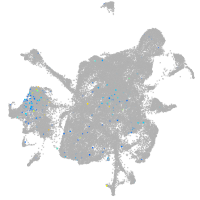
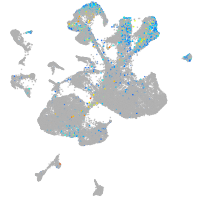
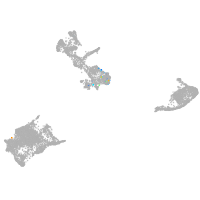
Correlated gene expression
Positive correlation
Negative correlation
Gene
r
Gene
r
znf1004
0.349
rps26l
-0.079
LOC101884541
0.339
rpsa
-0.060
XLOC-023624
0.336
fosab
-0.056
LOC110439948
0.323
eef2b
-0.056
LOC103911938
0.309
zgc:56493
-0.056
CR854907.1
0.288
hdlbpa
-0.056
CR391930.1
0.272
rps2
-0.055
tmem235
0.269
rpl23a
-0.055
sgsm1b
0.261
rpl11
-0.053
citb
0.261
eef1da
-0.052
si:ch211-25d12.7
0.254
s100v2
-0.052
mir7a-1
0.249
rpl6
-0.051
XLOC-035196
0.243
id1
-0.051
grid2ipb
0.241
actb2
-0.051
LOC101884382
0.240
tagln2
-0.051
sh3gl2b
0.239
rpl30
-0.051
fam49al
0.227
capns1a
-0.051
si:ch73-122g19.1
0.226
eef1a1l1
-0.051
LOC108181407
0.226
rpl3
-0.050
camkvb
0.226
ier2b
-0.050
elmod1
0.224
arhgdia
-0.050
gabrb4
0.222
zgc:92744
-0.050
ksr2
0.221
eno3
-0.049
nrsn1
0.214
rpl5a
-0.049
si:ch211-113a14.6
0.213
btg2
-0.049
prdm12a
0.213
rpl34
-0.049
rundc3aa
0.212
pak2a
-0.048
XLOC-043762
0.212
si:dkey-102c8.3
-0.048
CU856344.2
0.212
zgc:153284
-0.048
mtus2a
0.210
anxa1a
-0.048
fbxo41
0.207
zgc:162730
-0.047
htr1fa
0.206
spaca4l
-0.047
foxb2
0.203
thy1
-0.046
si:dkey-175g6.2
0.199
krt8
-0.046
si:dkey-261m9.9.3
0.198
rps15a
-0.046