Daniocell
asah1a (all cells)
N-acylsphingosine amidohydrolase (acid ceramidase) 1a
ZFIN
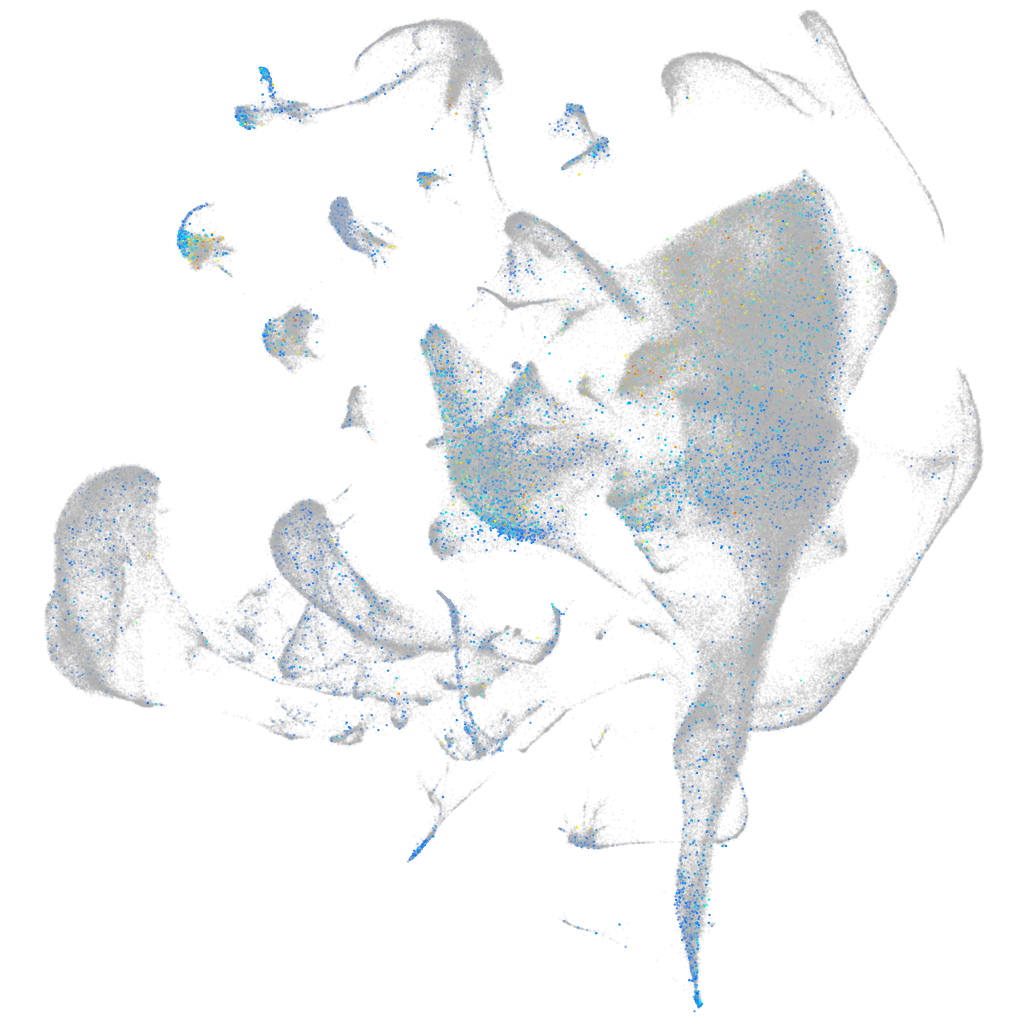
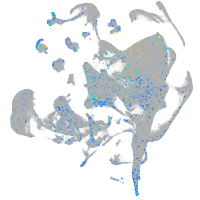
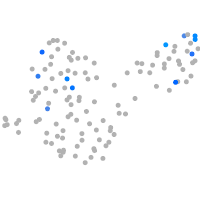
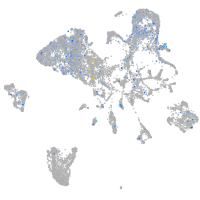
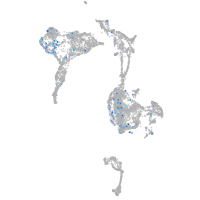
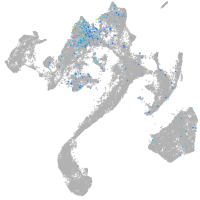
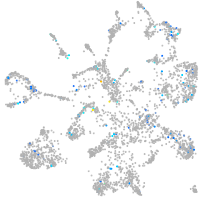
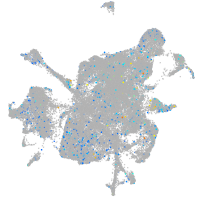
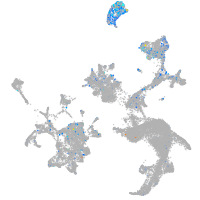
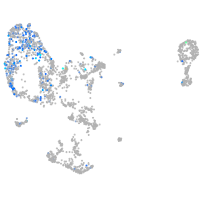
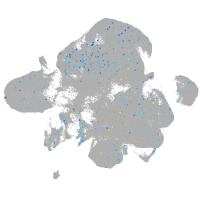
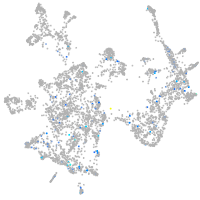
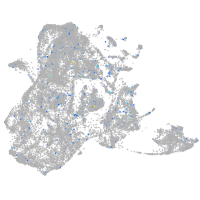
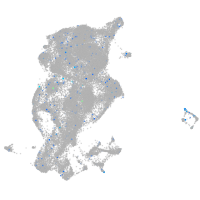
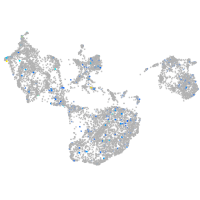
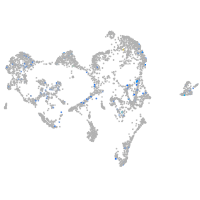
Gene expression UMAP
Display:
Expression
Stage
Other cell groups
all cells
blastomeres
PGCs
endoderm
axial mesoderm
muscle
mural cells /
non-skeletal muscle
mesenchyme
hematopoietic /
vasculature
pronephros
neural
spinal cord / glia
eye
taste / olfactory
otic / lateral line
epidermis
periderm
fin
ionocytes / mucous
pigment cells
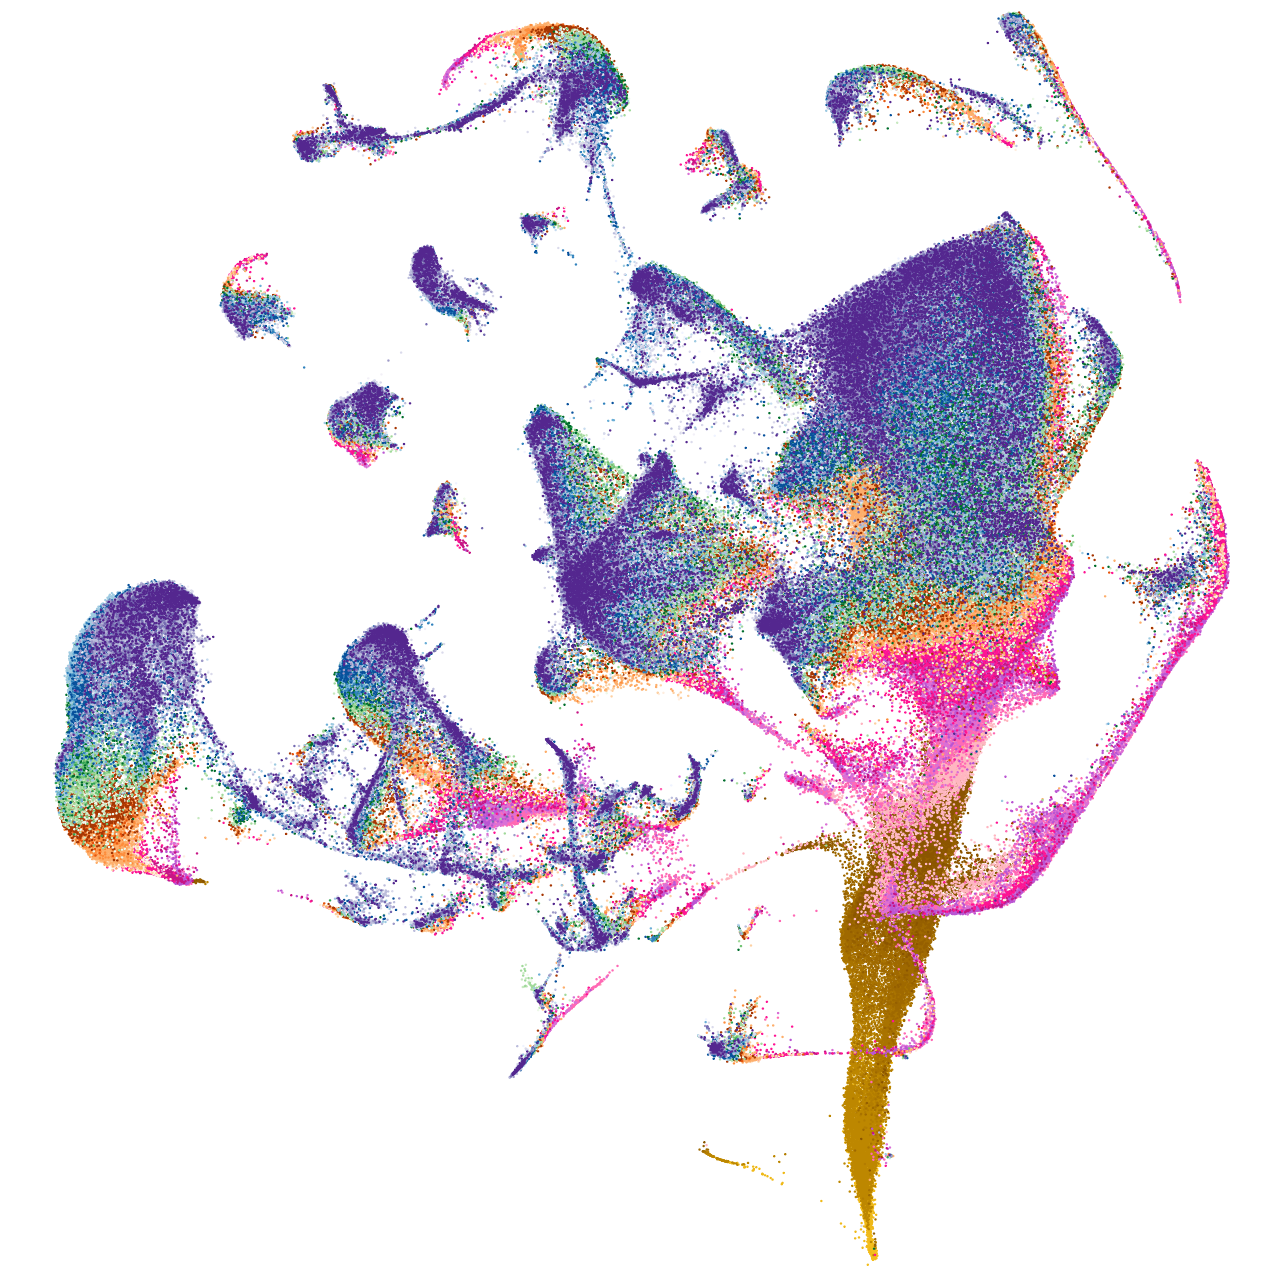
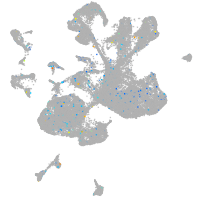
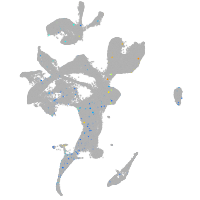
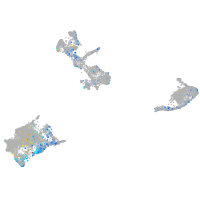
Expression by stage/cluster
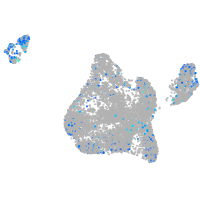
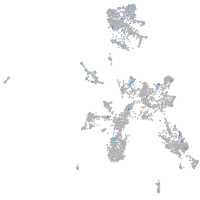
Correlated gene expression
Positive correlation
Negative correlation
Gene
r
Gene
r
ctss2.1
0.115
nova2
-0.027
cfbl
0.112
tuba1c
-0.026
si:ch211-193e13.5
0.110
rtn1a
-0.024
si:ch211-276a23.5
0.105
tuba1a
-0.024
si:dkey-27h10.2
0.104
apex1
-0.023
alox5ap
0.103
BX927258.1
-0.023
si:dkey-102g19.3
0.103
cyt1l
-0.023
CABZ01001434.1
0.100
elavl3
-0.023
il1b
0.100
hmgb3a
-0.023
mpx
0.100
cyt1
-0.022
scpp8
0.100
anxa1c
-0.020
glipr1a
0.099
atp6v0cb
-0.020
itgb2
0.099
CABZ01075068.1
-0.020
spi1b
0.099
gpm6aa
-0.020
si:ch73-343l4.8
0.099
actc1b
-0.019
fcer1gl
0.098
hrc
-0.019
il6r
0.098
hsp90aa1.1
-0.019
si:ch211-8c17.2
0.098
icn2
-0.019
ctss1
0.097
marcksb
-0.019
ch25hl2
0.097
nr6a1a
-0.019
CU499336.2
0.097
rnasekb
-0.019
ncf1
0.097
si:ch211-137a8.4
-0.019
si:ch211-284o19.8
0.096
sypb
-0.019
sc:d156
0.096
ttn.1
-0.019
coro1a
0.095
ttn.2
-0.019
mmp13a
0.094
XLOC-032526
-0.019
si:dkey-195m11.11
0.093
zgc:193505
-0.019
adgrg3
0.092
CABZ01072309.1
-0.018
myo1f
0.092
desma
-0.018
LOC101884267
0.091
epb41a
-0.018
LOC101885706
0.091
ewsr1a
-0.018
si:ch73-248e21.5
0.091
hmgb1b
-0.018
si:ch211-243a20.4
0.091
hnrnpa0a
-0.018
fybb
0.090
lye
-0.018
laptm5
0.090
nexn
-0.018