Daniocell
arid1aa (otic / lateral line)
AT rich interactive domain 1Aa (SWI-like)
ZFIN
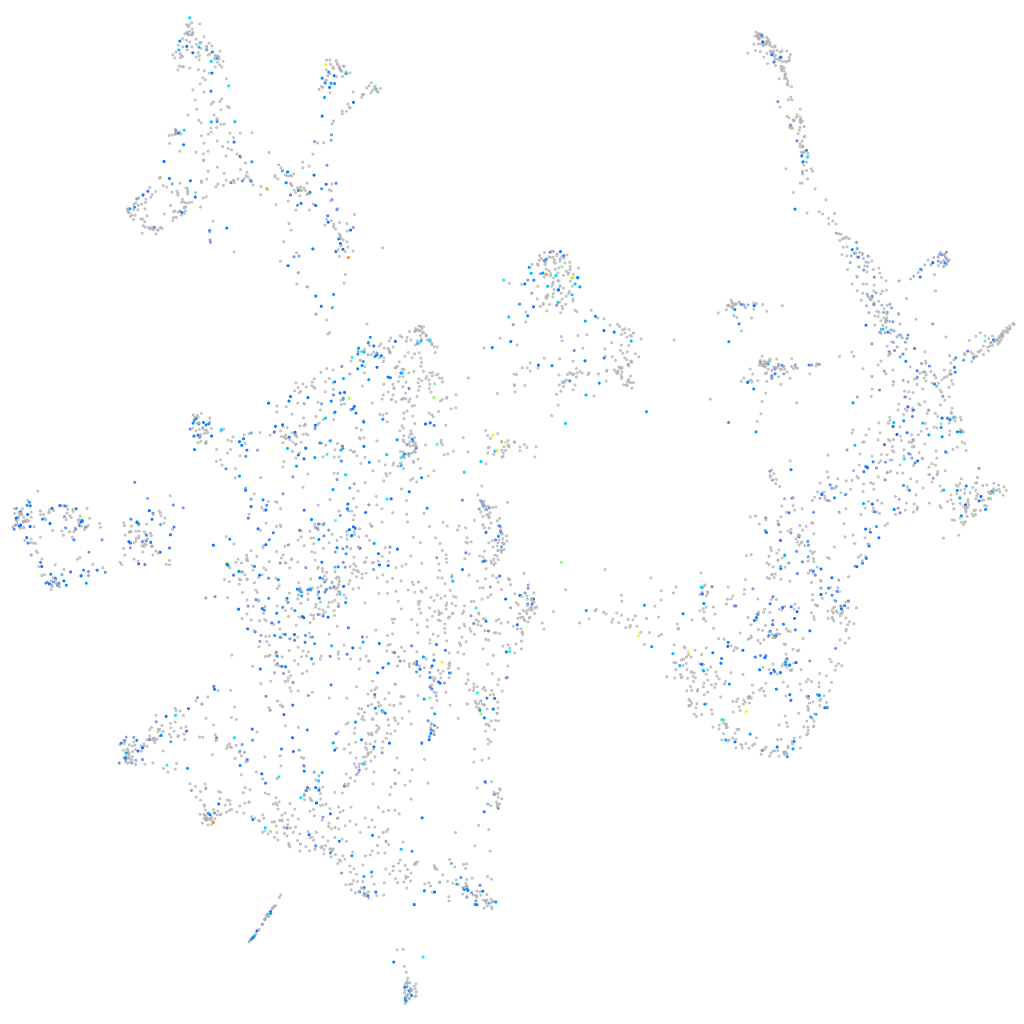
Gene expression UMAP
Display:
Expression
Stage
Other cell groups
all cells
blastomeres
PGCs
endoderm
axial mesoderm
muscle
mural cells /
non-skeletal muscle
mesenchyme
hematopoietic /
vasculature
pronephros
neural
spinal cord / glia
eye
taste / olfactory
otic / lateral line
epidermis
periderm
fin
ionocytes / mucous
pigment cells
Expression by stage/cluster
Correlated gene expression
Positive correlation
Negative correlation
Gene
r
Gene
r
mbd3b
0.119
anxa5a
-0.074
XLOC-037556
0.116
s100t
-0.073
si:ch211-222l21.1
0.114
pvalb8
-0.073
chd4a
0.113
si:ch211-255p10.3
-0.069
eif4g1a
0.113
selenow2b
-0.069
hnrnpul1l
0.112
fthl31
-0.068
hnrnpaba
0.110
BX511021.1
-0.068
marcksb
0.108
pvalb1
-0.066
CABZ01067979.1
0.107
si:dkey-16p21.8
-0.064
si:ch211-288g17.3
0.107
apoa2
-0.063
znf988
0.106
fthl28
-0.061
syncrip
0.105
gsto2
-0.061
alyref
0.103
apoa1b
-0.060
nucks1a
0.103
wu:fb18f06
-0.060
seta
0.103
si:ch211-153b23.5
-0.059
ankrd63
0.103
tmem240b
-0.059
hnrnpa0l
0.103
chrna9
-0.058
smarce1
0.102
sult6b1
-0.057
LOC101886946.1
0.102
abcb5
-0.057
ewsr1a
0.101
tekt3
-0.056
smarcc1a
0.100
gstp1
-0.054
chd7
0.099
strc1
-0.054
rsf1b.1
0.098
si:ch211-145b13.5
-0.054
snrpb
0.098
TSTD1
-0.054
hnrnpa1a
0.098
odf3l2a
-0.053
sox10
0.098
slc30a10
-0.053
hmga1a
0.097
pvalb2
-0.052
LOC103911601
0.097
nqo1
-0.052
khdrbs1a
0.096
sqstm1
-0.052
hmgb1b
0.096
txn
-0.052
apex1
0.095
nme5
-0.052
trhr2
0.095
prss59.1
-0.051
atrx
0.094
si:dkey-11c5.11
-0.051
chd4b
0.094
gpx2
-0.051
si:ch73-46j18.5
0.094
osbp2
-0.051