Daniocell
arhgef37 (blastomeres)
Rho guanine nucleotide exchange factor (GEF) 37
ZFIN
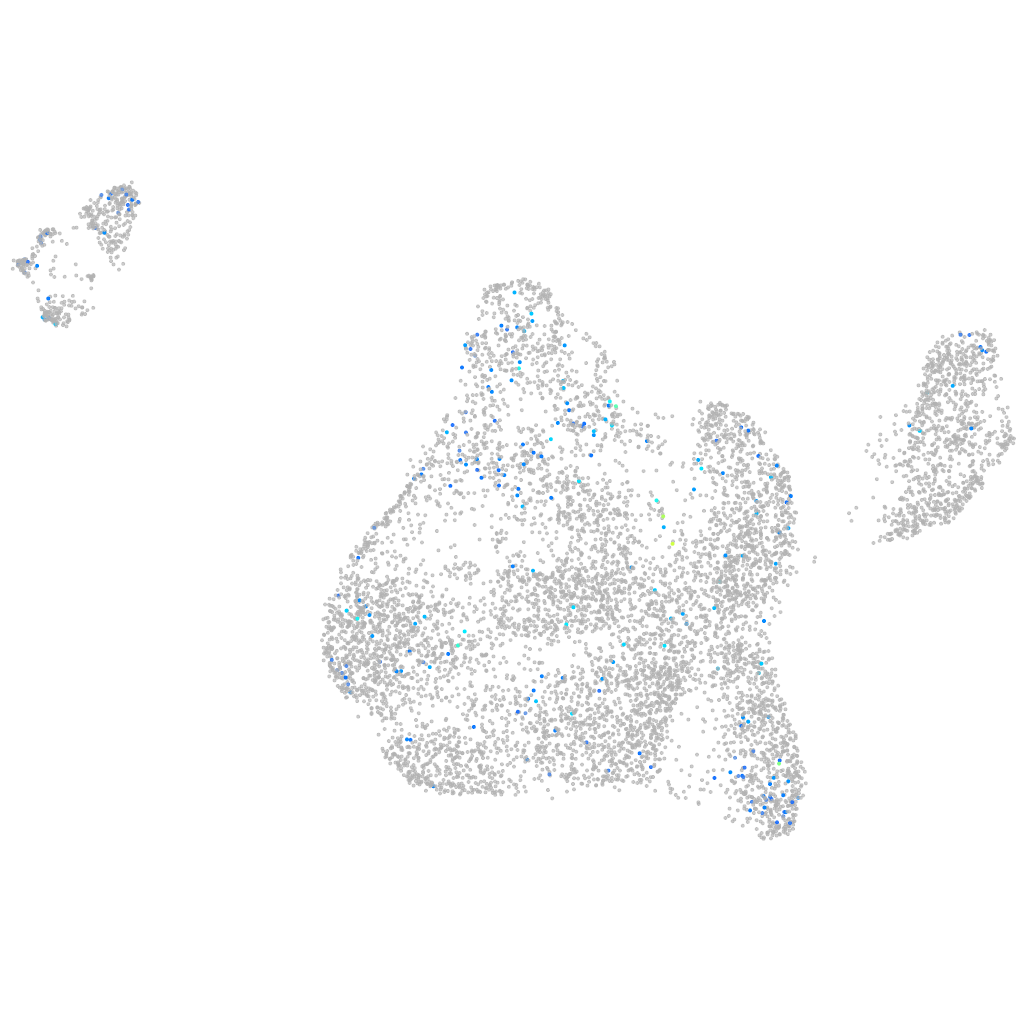
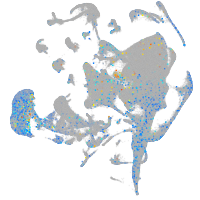
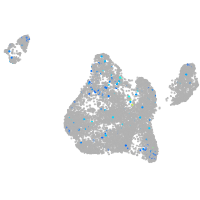
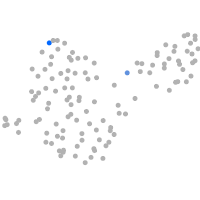
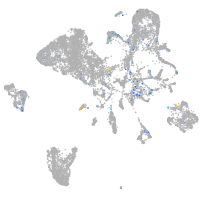
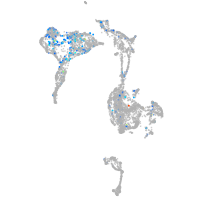
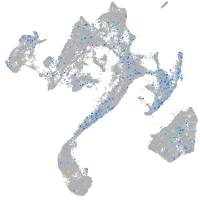
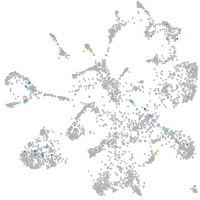
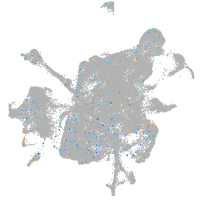
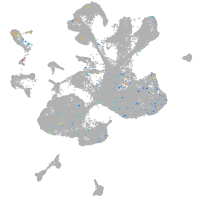
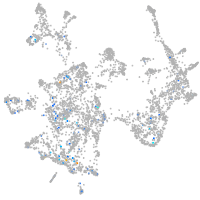
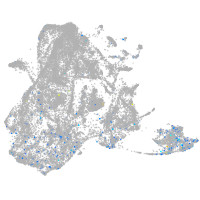
Gene expression UMAP
Display:
Expression
Stage
Other cell groups
all cells
blastomeres
PGCs
endoderm
axial mesoderm
muscle
mural cells /
non-skeletal muscle
mesenchyme
hematopoietic /
vasculature
pronephros
neural
spinal cord / glia
eye
taste / olfactory
otic / lateral line
epidermis
periderm
fin
ionocytes / mucous
pigment cells
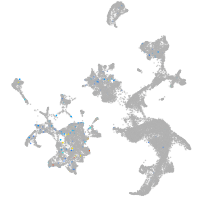
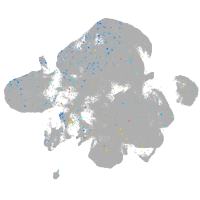
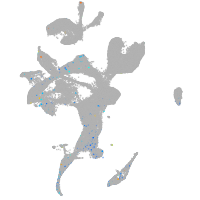
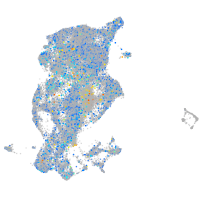
Expression by stage/cluster
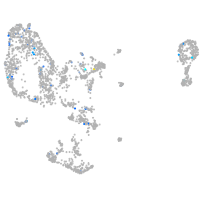
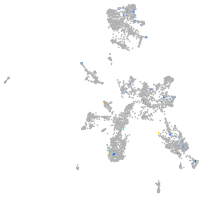
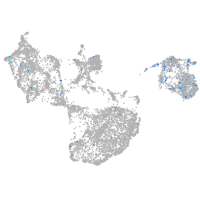
Correlated gene expression
Positive correlation
Negative correlation
Gene
r
Gene
r
LOC108181518
0.139
sox3
-0.050
RF00045
0.113
LOC108190024
-0.049
XLOC-042923
0.111
apoeb
-0.042
si:ch73-40a2.1
0.105
si:ch211-170d8.2
-0.040
cyp1c2
0.102
sox19a
-0.036
ugt5b3
0.100
gata2a
-0.034
LOC110439797
0.100
ppp2r3b
-0.033
LOC570163
0.100
stk35l
-0.032
si:dkey-237j11.3
0.100
si:ch1073-80i24.3
-0.032
zgc:85843
0.095
snai2
-0.031
BX323987.1
0.093
hspe1
-0.030
si:ch211-252f13.5
0.093
bambia
-0.029
LOC108179593
0.092
crabp2b
-0.029
rapgef6
0.091
marcksl1b
-0.028
CT583728.4
0.091
gtf3c5
-0.028
LOC110437817
0.090
mych
-0.028
si:ch211-284e20.8
0.090
slc20a1b
-0.028
XLOC-028243
0.089
szl
-0.026
FO704721.2
0.088
rgcc
-0.026
hoxc13a
0.088
pfkfb4b
-0.026
CR626886.2
0.088
ved
-0.025
LOC103910741
0.088
cog7
-0.025
si:ch73-256j6.4
0.088
nuak2
-0.024
zgc:172282
0.084
ssbp3a
-0.024
gipr
0.083
nat8l
-0.024
pcdh10a
0.083
glulb
-0.024
ntn2
0.082
id1
-0.024
BX842240.1
0.082
tmem18
-0.024
ggt1a
0.081
pgd
-0.023
nmur1a
0.081
cited4b
-0.023
dlg4b
0.080
prkag1
-0.023
btbd11b
0.080
lta4h
-0.023
BX890608.1
0.079
tagln2
-0.023
pmfbp1
0.078
pkdccb
-0.023
chrd
0.078
LOC101884098
-0.023