Daniocell
arhgap25 (endoderm)
Rho GTPase activating protein 25
ZFIN
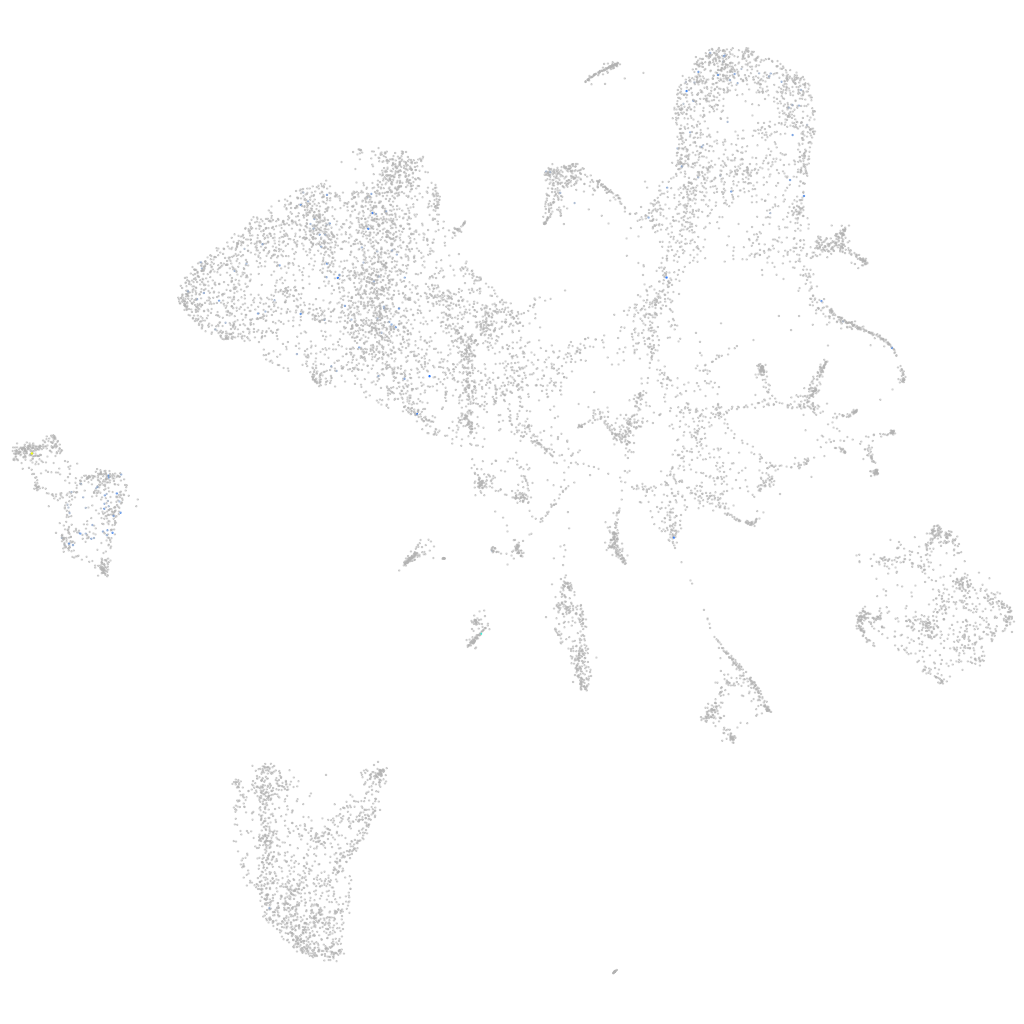
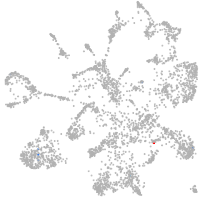
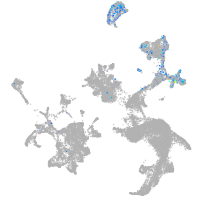
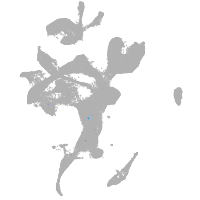
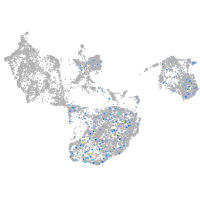
Gene expression UMAP
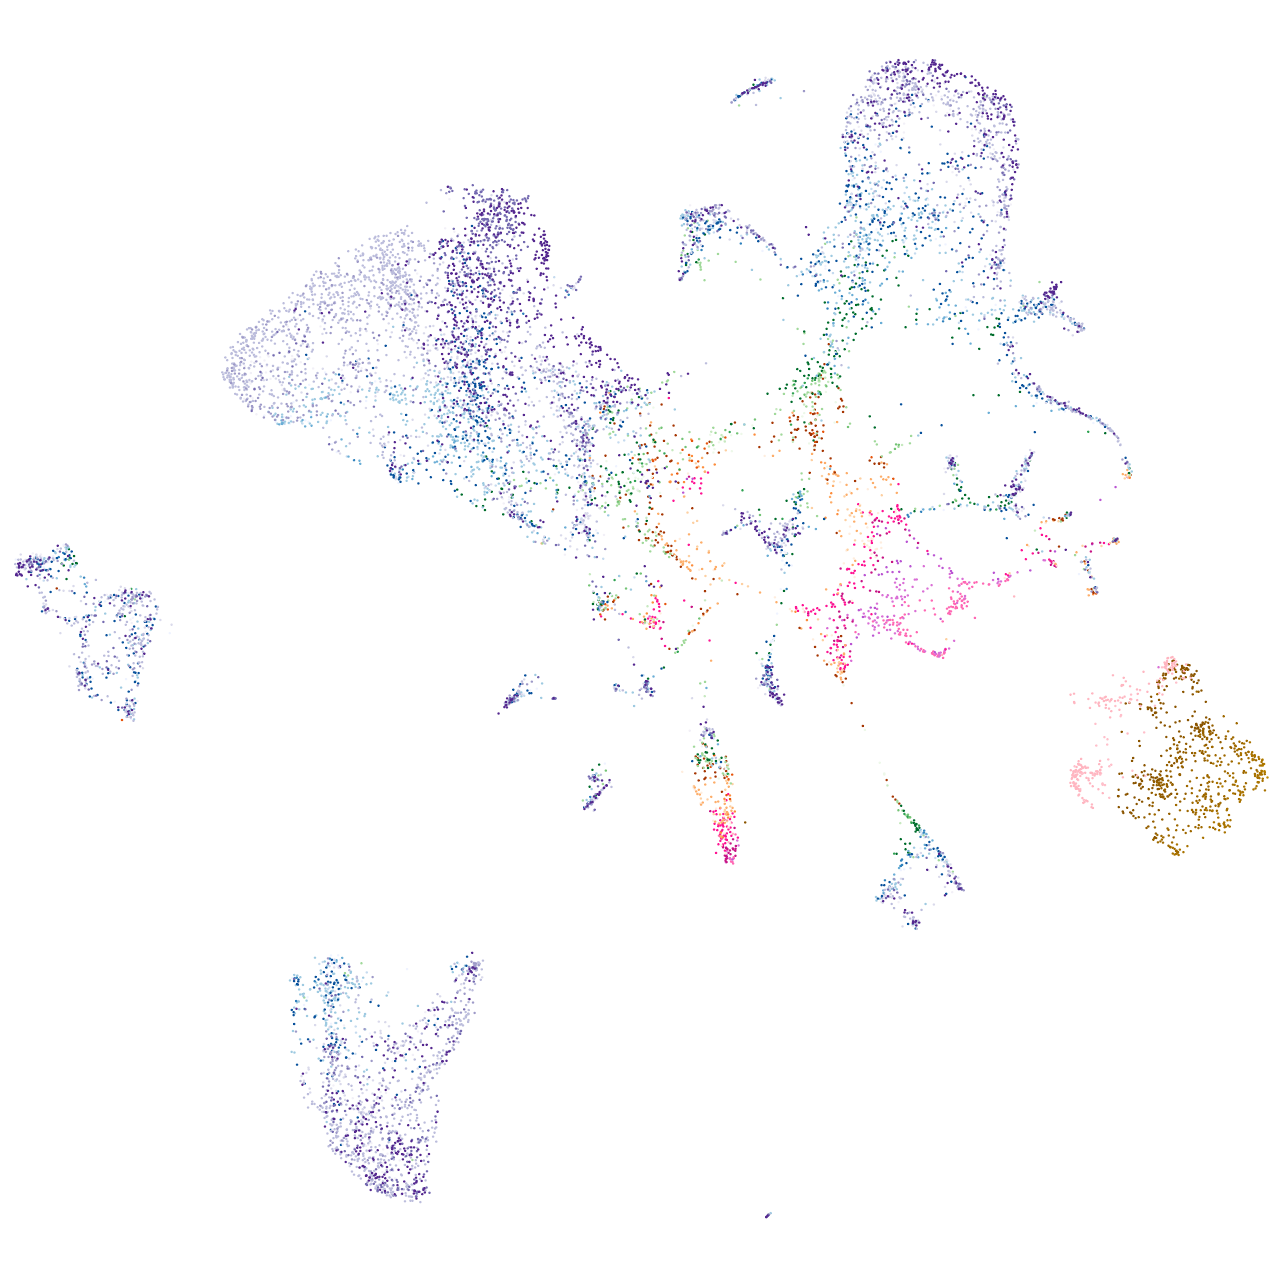
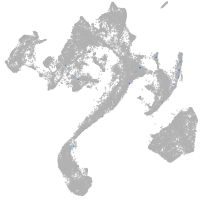
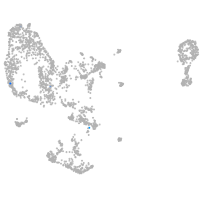
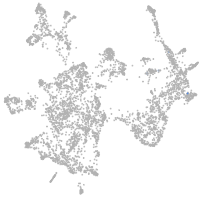
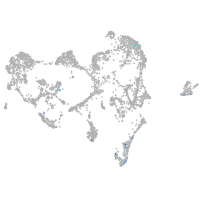
Display:
Expression
Stage
Other cell groups
all cells
blastomeres
PGCs
endoderm
axial mesoderm
muscle
mural cells /
non-skeletal muscle
mesenchyme
hematopoietic /
vasculature
pronephros
neural
spinal cord / glia
eye
taste / olfactory
otic / lateral line
epidermis
periderm
fin
ionocytes / mucous
pigment cells
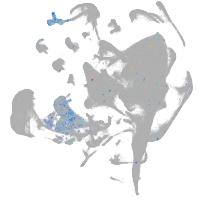
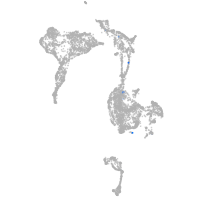
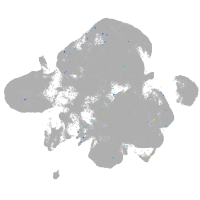
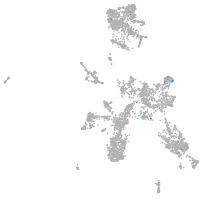
Expression by stage/cluster
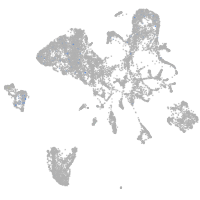
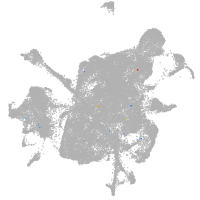
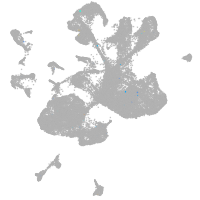
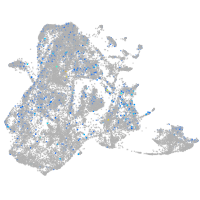
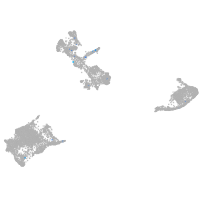
Correlated gene expression
Positive correlation
Negative correlation
Gene
r
Gene
r
si:dkey-97a13.12
0.260
rtn1a
-0.041
LOC101885844
0.218
ctrl
-0.032
lgals17
0.195
marcksb
-0.032
mhc1uma
0.173
prss59.2
-0.032
si:dkey-251i10.1
0.172
prss59.1
-0.031
CABZ01064472.1
0.163
fep15
-0.031
syt7a
0.151
abcf1
-0.031
si:dkeyp-117b11.1
0.141
erp27
-0.031
si:ch73-31d8.2
0.135
cpb1
-0.031
fas
0.126
ctrb1
-0.031
LOC100007100
0.121
cel.1
-0.031
fat2
0.120
pdia2
-0.030
si:ch211-25g7.5
0.118
apoda.2
-0.030
CABZ01088036.1
0.117
sycn.2
-0.030
apba1a
0.111
cpa5
-0.030
otud4
0.108
si:ch211-240l19.5
-0.030
si:dkeyp-82a1.4
0.107
prss1
-0.030
LOC108190763
0.103
hmgb3a
-0.030
si:dkey-120c6.5
0.103
c6ast4
-0.030
BX284696.1
0.102
cel.2
-0.030
si:dkey-165o8.2
0.100
amy2a
-0.029
cpt1cb
0.098
cpa4
-0.029
ablim2
0.098
hnrnph1l
-0.029
chrm1a
0.098
endou
-0.028
lamb4
0.097
tmed6
-0.028
six5
0.097
zgc:92137
-0.028
cldn1
0.096
npdc1a
-0.028
dse
0.096
si:ch211-240l19.6
-0.028
si:rp71-77l1.1
0.095
hspb1
-0.028
xkr8.1
0.095
cd81a
-0.028
lacc1
0.094
idh2
-0.028
isg15
0.093
nucks1a
-0.028
CR854839.1
0.093
prmt1
-0.028
muc5f
0.092
akap12b
-0.028
slc25a23a
0.092
CELA1 (1 of many)
-0.027