Daniocell
arhgap17b (blastomeres)
Rho GTPase activating protein 17b
ZFIN
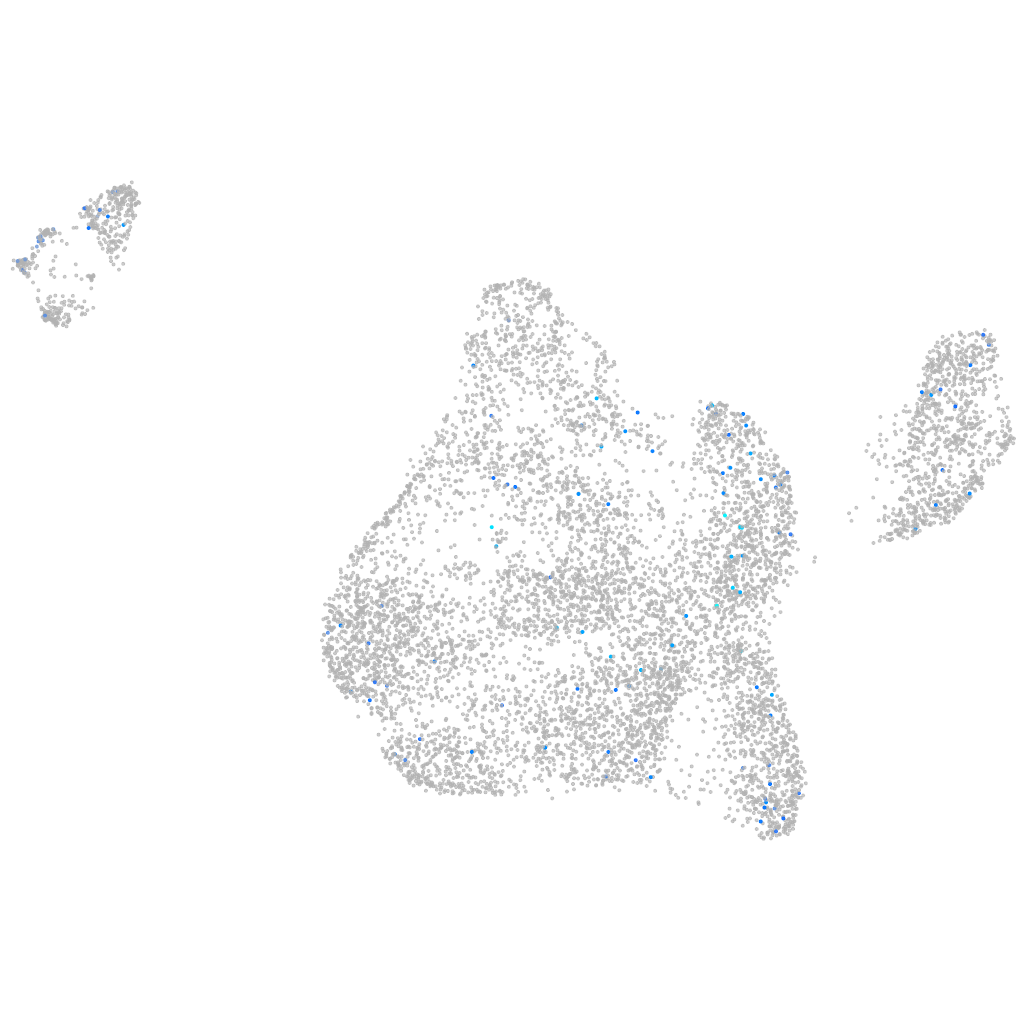
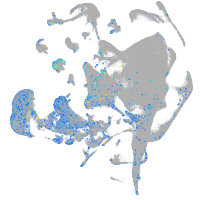
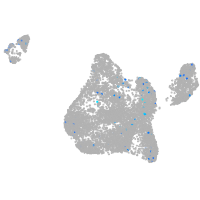
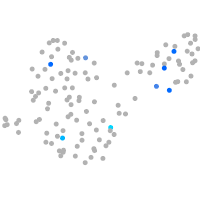
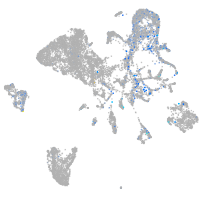
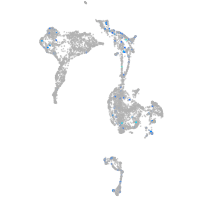
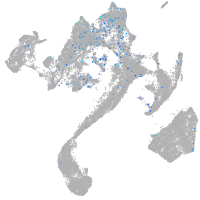
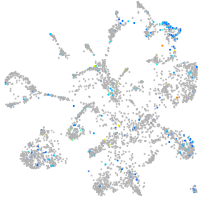
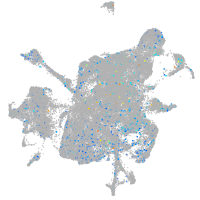
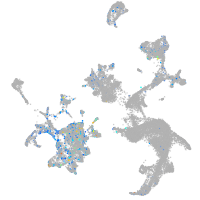
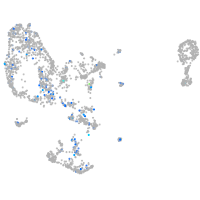
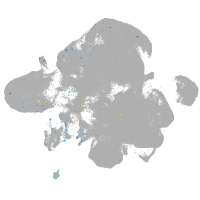
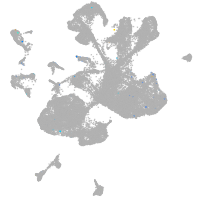
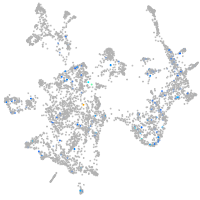
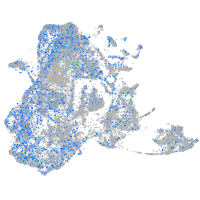
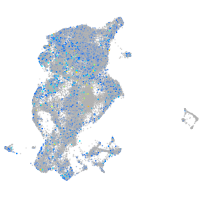
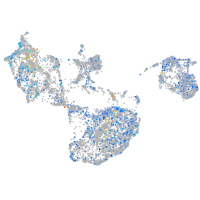
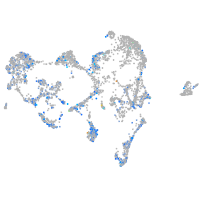
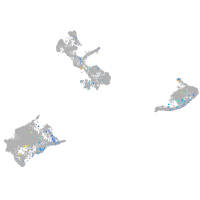
Gene expression UMAP
Display:
Expression
Stage
Other cell groups
all cells
blastomeres
PGCs
endoderm
axial mesoderm
muscle
mural cells /
non-skeletal muscle
mesenchyme
hematopoietic /
vasculature
pronephros
neural
spinal cord / glia
eye
taste / olfactory
otic / lateral line
epidermis
periderm
fin
ionocytes / mucous
pigment cells
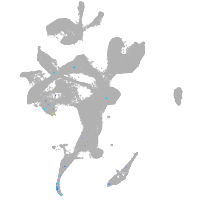
Expression by stage/cluster
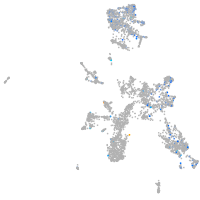
Correlated gene expression
Positive correlation
Negative correlation
Gene
r
Gene
r
BX510342.1
0.136
CR383676.1
-0.034
CR762407.2
0.131
rpsa
-0.032
si:dkey-21e2.3
0.122
srsf9
-0.030
CR847983.1
0.119
psmb7
-0.030
parietopsin
0.119
khdrbs1a
-0.029
CABZ01109480.1
0.116
ddx24
-0.028
LOC108179246
0.115
p4ha2
-0.028
XLOC-025107
0.110
rps24
-0.027
cpne7
0.108
xpo1a
-0.027
si:dkey-51e6.1
0.104
leng1
-0.027
atf6b
0.104
hspb1
-0.027
drd2b
0.104
si:ch73-281n10.2
-0.027
XLOC-011133
0.103
tpt1
-0.026
omd
0.103
si:dkey-67c22.2
-0.026
CR974475.1
0.101
rps4x
-0.026
kcnip3a
0.101
rps26l
-0.026
si:ch1073-100f3.2
0.100
h2afvb
-0.025
gpr185a
0.099
fthl27
-0.025
synpo2lb
0.098
anapc16
-0.025
sstr1b
0.097
ccdc137
-0.025
epx
0.095
hnrnpa0b
-0.025
LOC103909138
0.094
eef1a1l1
-0.025
LOC103908925
0.093
si:ch211-152c2.3
-0.025
LOC101885444
0.093
rps23
-0.025
LOC103910375
0.091
rbm34
-0.025
si:dkey-88e18.8
0.090
cmc1
-0.024
RF00342
0.090
serpinh1b
-0.024
LOC110437748
0.088
sec13
-0.024
tacr1b
0.085
cdc20
-0.024
fam151a
0.084
zmat2
-0.024
RF01190
0.084
slbp
-0.023
BX649398.3
0.084
anxa13l
-0.023
BX571712.1
0.083
rpl7
-0.023
bmp3
0.083
ube2ia
-0.023
CABZ01067151.2
0.083
flrt3
-0.023