Daniocell
apex2 (fin)
APEX nuclease (apurinic/apyrimidinic endonuclease) 2
ZFIN
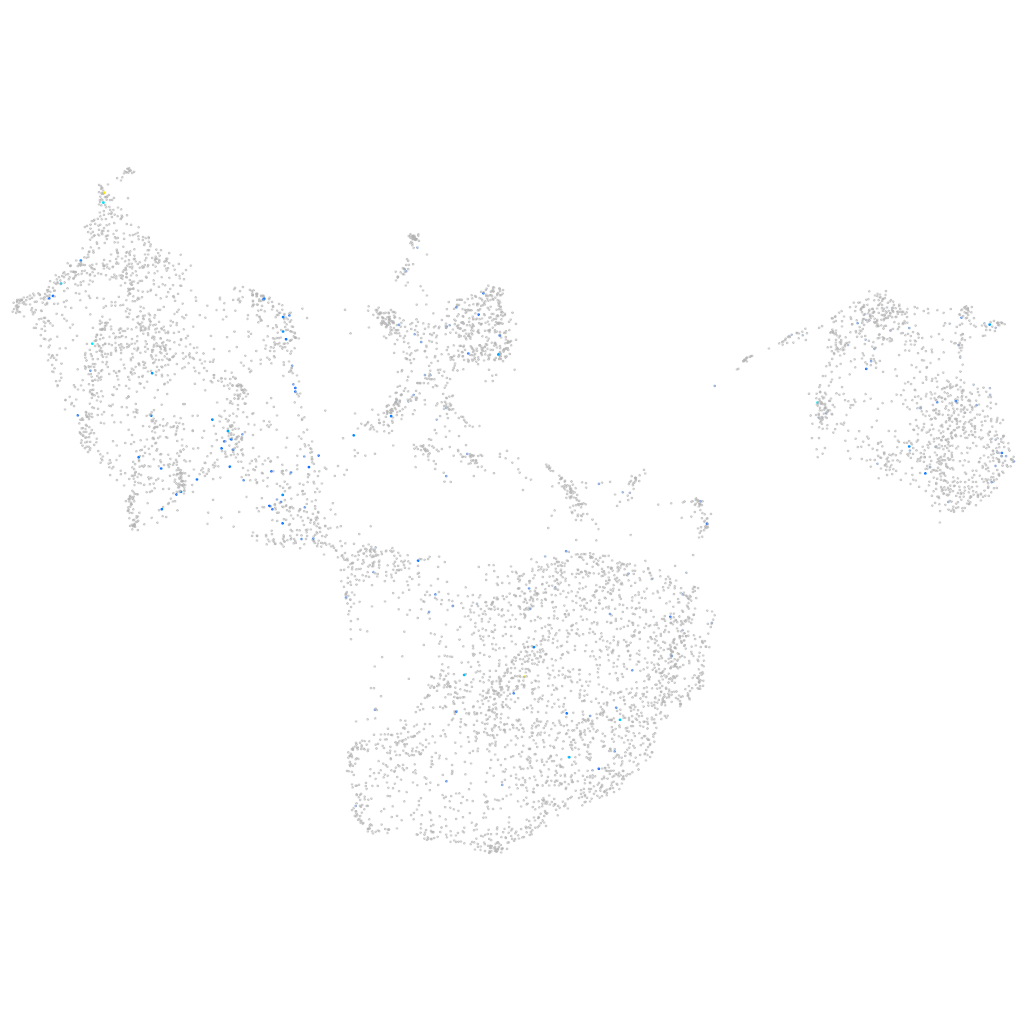
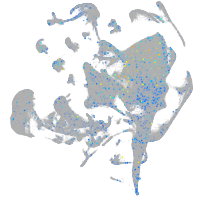
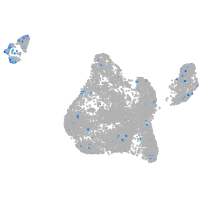
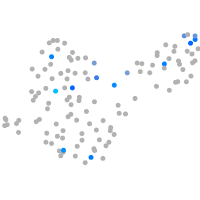
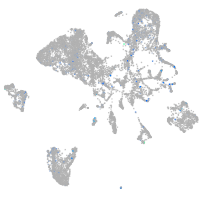
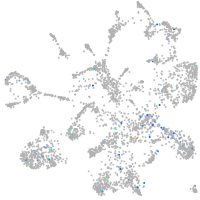
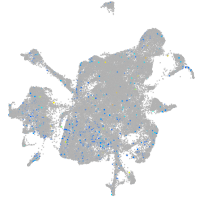
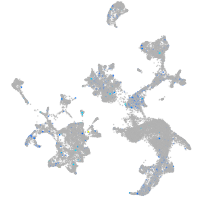
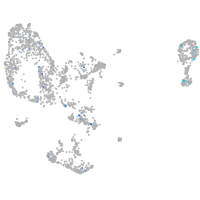
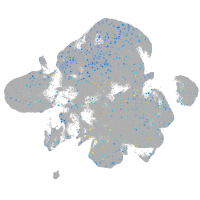
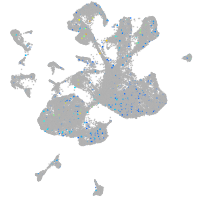
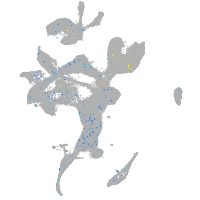
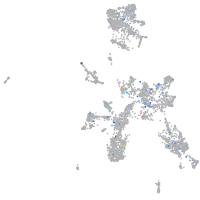
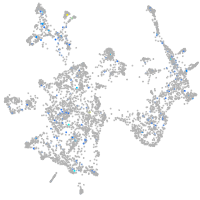
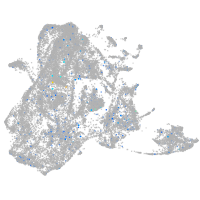
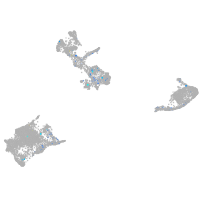
Gene expression UMAP
Display:
Expression
Stage
Other cell groups
all cells
blastomeres
PGCs
endoderm
axial mesoderm
muscle
mural cells /
non-skeletal muscle
mesenchyme
hematopoietic /
vasculature
pronephros
neural
spinal cord / glia
eye
taste / olfactory
otic / lateral line
epidermis
periderm
fin
ionocytes / mucous
pigment cells
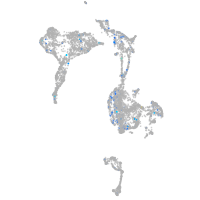
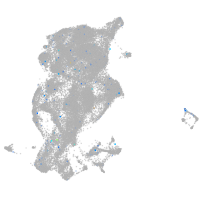
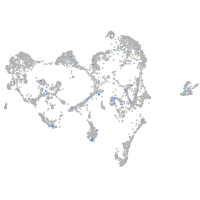
Expression by stage/cluster
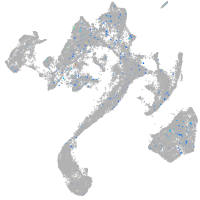
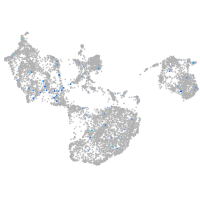
Correlated gene expression
Positive correlation
Negative correlation
Gene
r
Gene
r
CT025745.1
0.203
aqp3a
-0.052
LOC110437750
0.190
zgc:101810
-0.045
XLOC-004075
0.179
apoeb
-0.044
b4galnt4b
0.175
and2
-0.043
si:ch73-226i7.1
0.162
pfn1
-0.042
si:ch211-272b8.6
0.154
si:dkey-102c8.3
-0.040
znf1109
0.148
tspan33a
-0.040
CU683879.2
0.144
cldni
-0.038
LOC110438054
0.143
fmodb
-0.038
cryaba
0.134
tmsb1
-0.038
AL929171.1
0.132
si:rp71-77l1.1
-0.038
myct1a
0.129
rac2
-0.038
LOC101885924
0.121
fras1
-0.038
RF00096
0.119
zgc:86896
-0.037
XLOC-029661
0.118
cotl1
-0.037
XLOC-013497
0.115
sparc
-0.037
zgc:162239.1
0.106
gpd1c
-0.037
wdr91
0.104
pak2a
-0.037
trim46a
0.102
cfl1l
-0.036
sp100.2
0.099
capgb
-0.036
zgc:171844
0.099
sp6
-0.036
si:ch211-127d4.3
0.098
spint1a
-0.036
rbb4l
0.097
egfl6
-0.036
wdhd1
0.097
s100a10b
-0.036
LOC101886439
0.096
prrg2
-0.035
dtl
0.095
cyt1
-0.035
ibtk
0.094
and1
-0.035
XLOC-000817
0.093
itgav
-0.035
taco1
0.092
txn
-0.035
LOC110438175
0.092
sh3gl1a
-0.035
BX510924.1
0.092
lgals3b
-0.034
XLOC-004408
0.091
si:dkey-248g15.3
-0.034
BX571827.2
0.091
cdh1
-0.034
LOC100005584
0.091
tmem238a
-0.034
ccl38a.5
0.090
hhla2a.1
-0.034