Daniocell
ano2 (mural cells / non-skeletal muscle)
anoctamin 2 [Source:ZFIN;Acc:ZDB-GENE-060503-62]
ZFIN
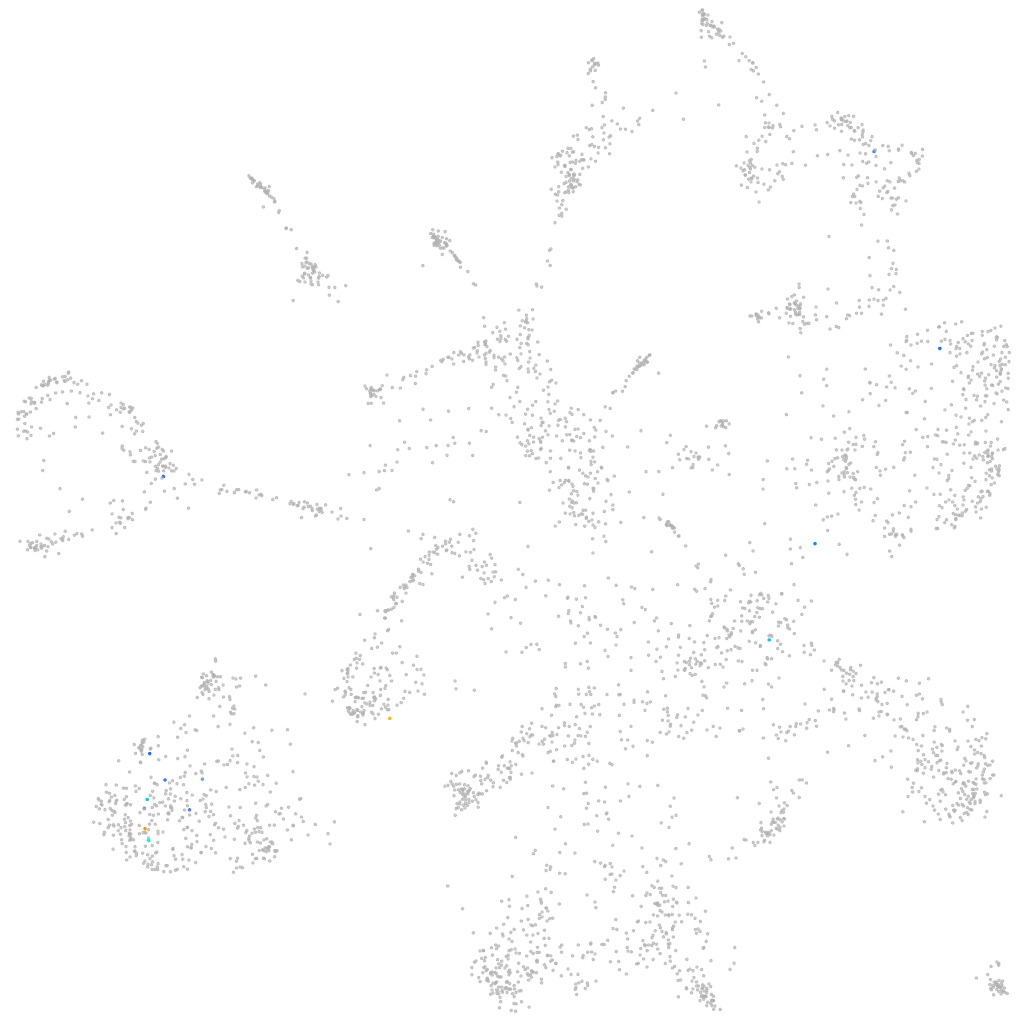
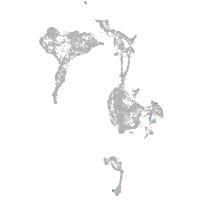
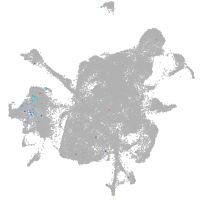
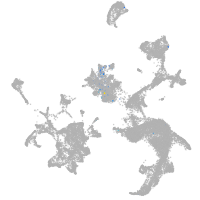
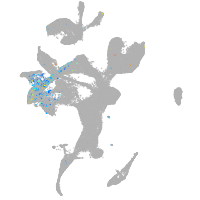
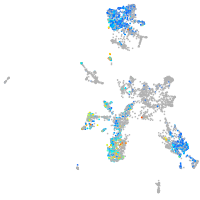
Gene expression UMAP
Display:
Expression
Stage
Other cell groups
all cells
blastomeres
PGCs
endoderm
axial mesoderm
muscle
mural cells /
non-skeletal muscle
mesenchyme
hematopoietic /
vasculature
pronephros
neural
spinal cord / glia
eye
taste / olfactory
otic / lateral line
epidermis
periderm
fin
ionocytes / mucous
pigment cells
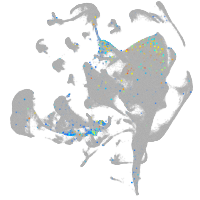
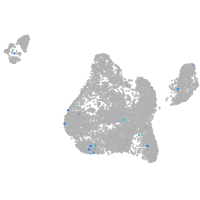
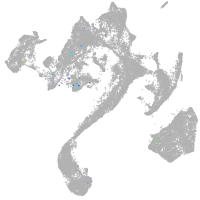
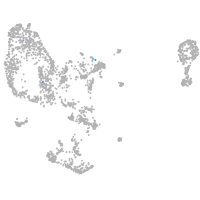
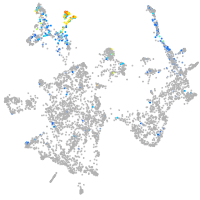
Expression by stage/cluster
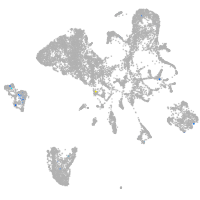
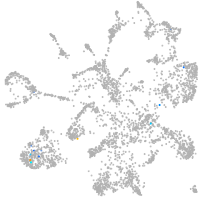
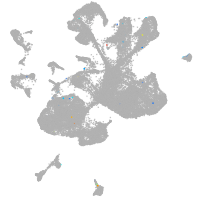
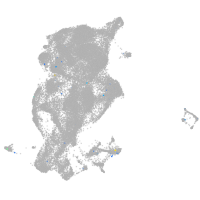
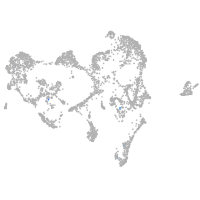
Correlated gene expression
Positive correlation
Negative correlation
Gene
r
Gene
r
LOC108182766
0.566
rpl37
-0.061
si:ch1073-82l19.1
0.566
slc25a5
-0.046
XLOC-023624
0.542
tpm4a
-0.044
si:dkeyp-72h1.1
0.423
sdc4
-0.040
LOC108183423
0.422
zgc:153867
-0.037
LOC110440213
0.421
ctsla
-0.036
rab27b
0.396
mcl1a
-0.035
synpr
0.386
fosab
-0.034
LOC108179567
0.366
sept10
-0.033
gng8
0.357
sept2
-0.031
zgc:101731
0.346
rplp1
-0.031
acmsd
0.343
tmem176l.1
-0.030
nwd2
0.338
zgc:56493
-0.030
BX005417.1
0.312
eef1da
-0.029
grm6a
0.303
flna
-0.029
si:ch211-189a15.5
0.295
ucp2
-0.029
rinl
0.294
sdcbp2
-0.029
nceh1b.1
0.284
f3b
-0.027
CABZ01112864.1
0.276
BX088707.3
-0.027
BX537305.1
0.275
actb2
-0.027
phf1
0.275
XLOC-028370
-0.027
zgc:165508
0.275
rps19
-0.027
LOC108192085
0.275
hand2
-0.027
fam78ab
0.273
si:ch211-286o17.1
-0.026
si:dkey-283b1.7
0.272
ier2b
-0.026
stx11b.2
0.269
id3
-0.026
si:dkey-240n22.3
0.267
mcl1b
-0.026
tmem163a
0.266
pkig
-0.026
etv1
0.260
si:ch1073-291c23.2
-0.026
xk
0.255
anxa13
-0.025
RASGRF1
0.252
olfml3b
-0.025
si:ch73-287m6.1
0.251
rps5
-0.025
lrrc3b
0.247
fzd2
-0.025
camta1
0.246
angptl4
-0.025
slc6a22.2
0.243
si:ch211-191j22.3
-0.025