Daniocell
anapc13 (mural cells / non-skeletal muscle)
anaphase promoting complex subunit 13
ZFIN
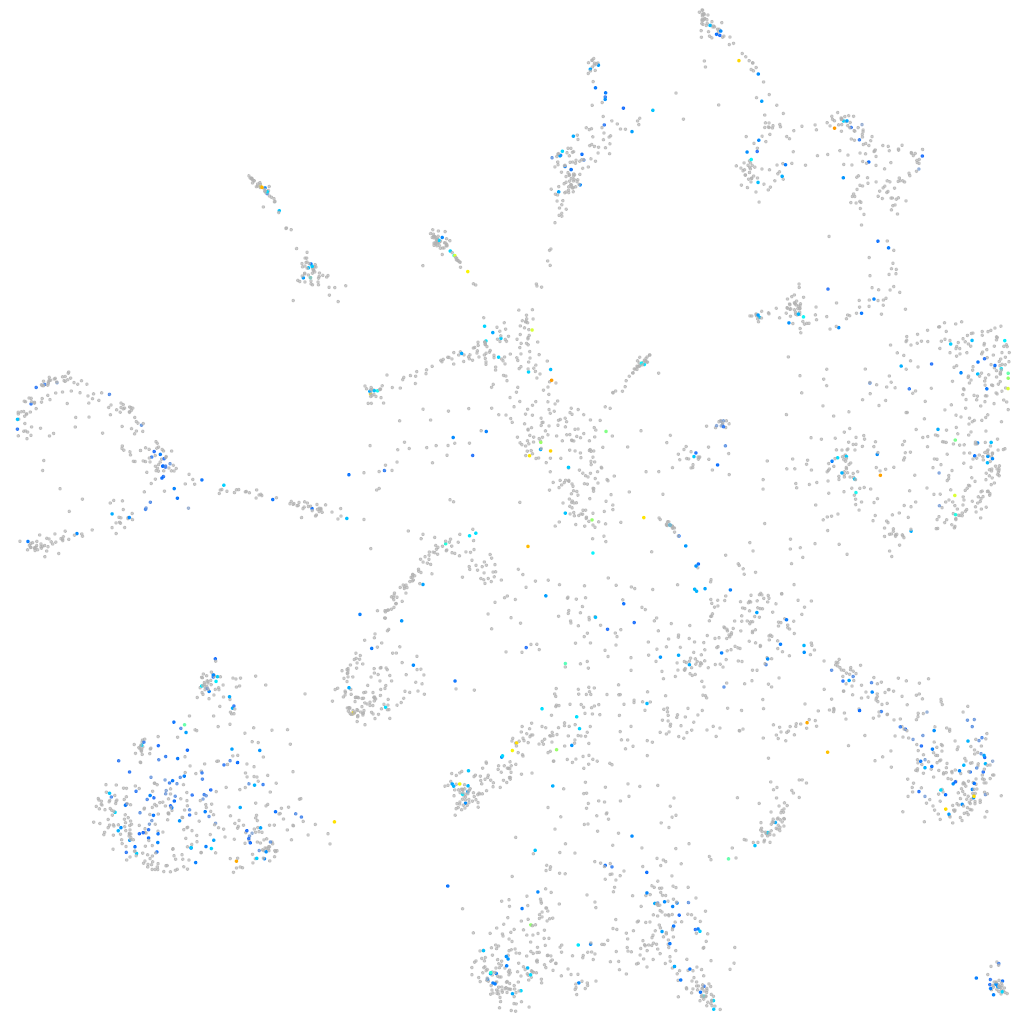
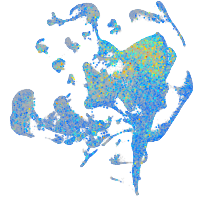
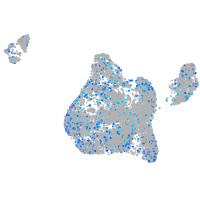
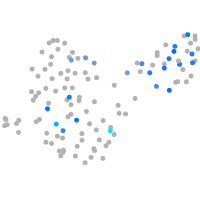
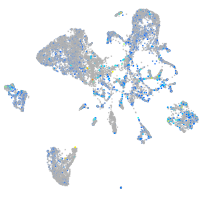
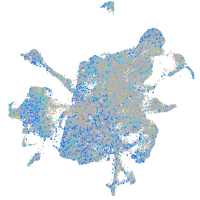
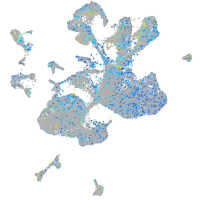
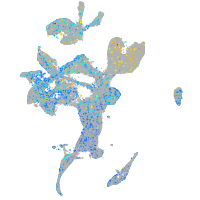
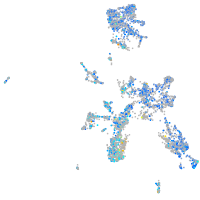
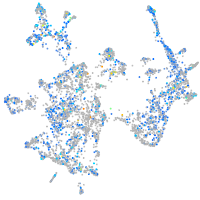
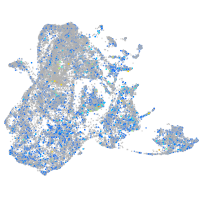
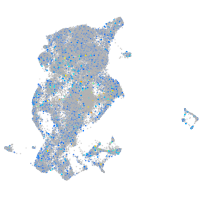
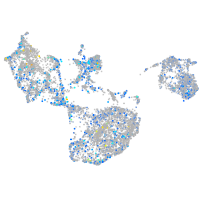
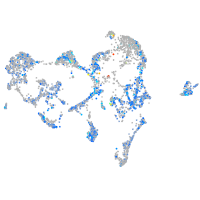
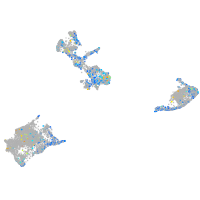
Gene expression UMAP
Display:
Expression
Stage
Other cell groups
all cells
blastomeres
PGCs
endoderm
axial mesoderm
muscle
mural cells /
non-skeletal muscle
mesenchyme
hematopoietic /
vasculature
pronephros
neural
spinal cord / glia
eye
taste / olfactory
otic / lateral line
epidermis
periderm
fin
ionocytes / mucous
pigment cells
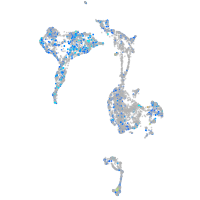
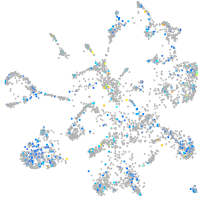
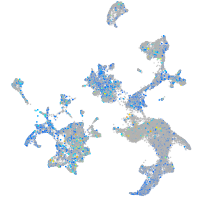
Expression by stage/cluster
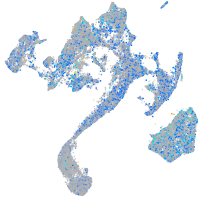
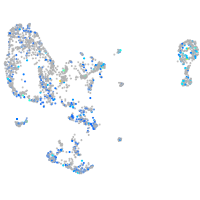
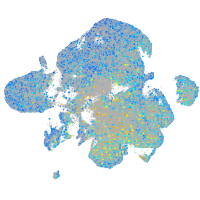
Correlated gene expression
Positive correlation
Negative correlation
Gene
r
Gene
r
ccdc157
0.122
col6a2
-0.057
XLOC-043229
0.115
rps18
-0.056
LOC101886712
0.110
col6a1
-0.055
CR392341.3
0.108
fstl1b
-0.052
BX284620.1
0.108
LO018340.1
-0.051
XLOC-009558
0.106
cnpy2
-0.048
lim2.4
0.101
dlc1
-0.044
tmc8
0.099
mt-nd3
-0.043
eif3bb
0.099
foxl1
-0.043
lipib
0.097
amd1
-0.043
BX511034.3
0.097
LOC110439372
-0.042
tlr5a
0.096
mt-co1
-0.042
rab25a
0.096
bgnb
-0.042
gatd3a
0.095
LOC100535210
-0.042
diras1a
0.094
smoc2
-0.041
slc19a3a
0.094
si:dkey-261h17.1
-0.041
LOC101882228
0.094
kirrel1a
-0.040
arhgef3
0.093
rhag
-0.040
si:dkey-165a24.9
0.093
klf12b
-0.040
ptk6b
0.092
nrg1
-0.039
LOC101883670
0.090
slc25a25a
-0.039
gramd2aa
0.090
si:ch73-335l21.4
-0.039
XLOC-005615
0.089
tacc1
-0.039
si:dkey-30c15.17
0.089
wu:fb16f03
-0.039
XLOC-004437
0.089
hs3st3b1b
-0.038
si:dkey-27h10.2
0.089
zgc:171967
-0.038
LOC101886433
0.089
col11a1a
-0.038
XLOC-023754
0.087
slc29a1b
-0.038
mff
0.086
si:ch73-367p23.2
-0.038
XLOC-039021
0.085
nrip1b
-0.038
zgc:152863
0.085
zgc:158463
-0.038
plekha1a
0.085
ela2
-0.038
cd59
0.085
lin28a
-0.037
lsm1
0.084
NC-002333.4
-0.037
si:dkey-45d16.4
0.084
PDCL3
-0.037