
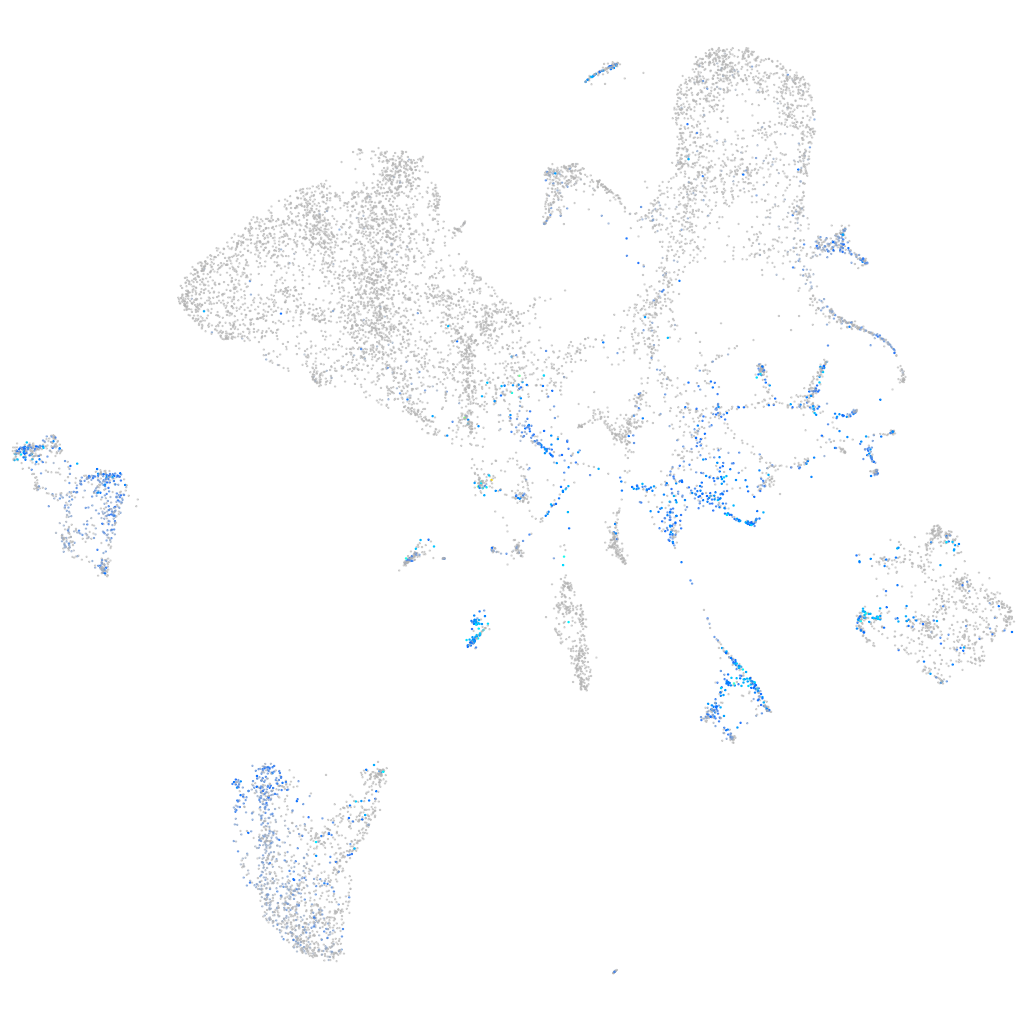
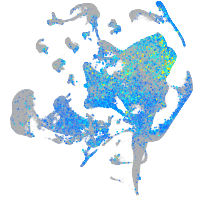
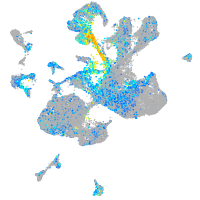
activated leukocyte cell adhesion molecule a
ZFIN 
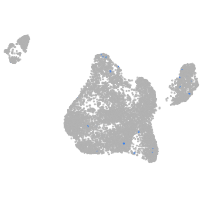
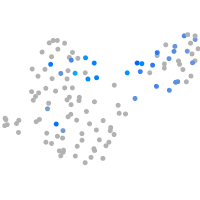
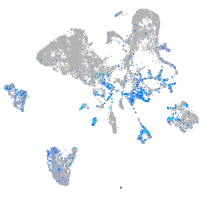
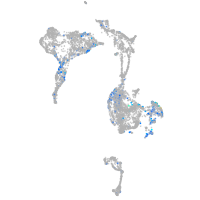
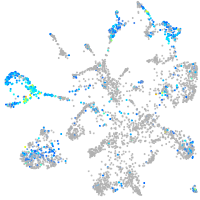
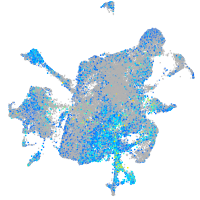
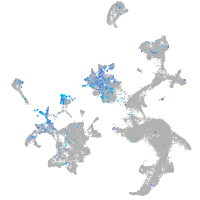
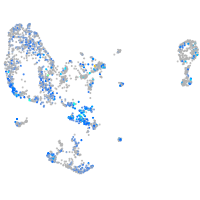
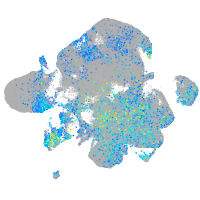
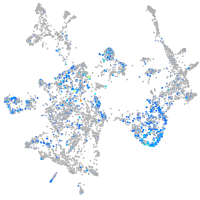
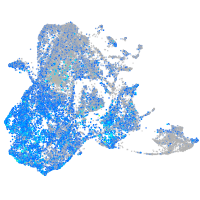
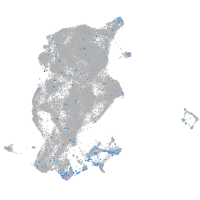
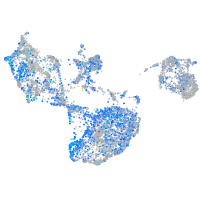
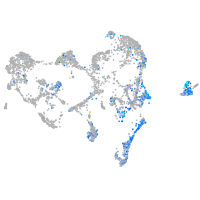
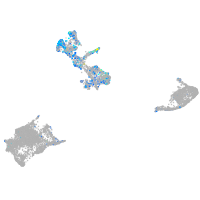
Gene expression UMAP


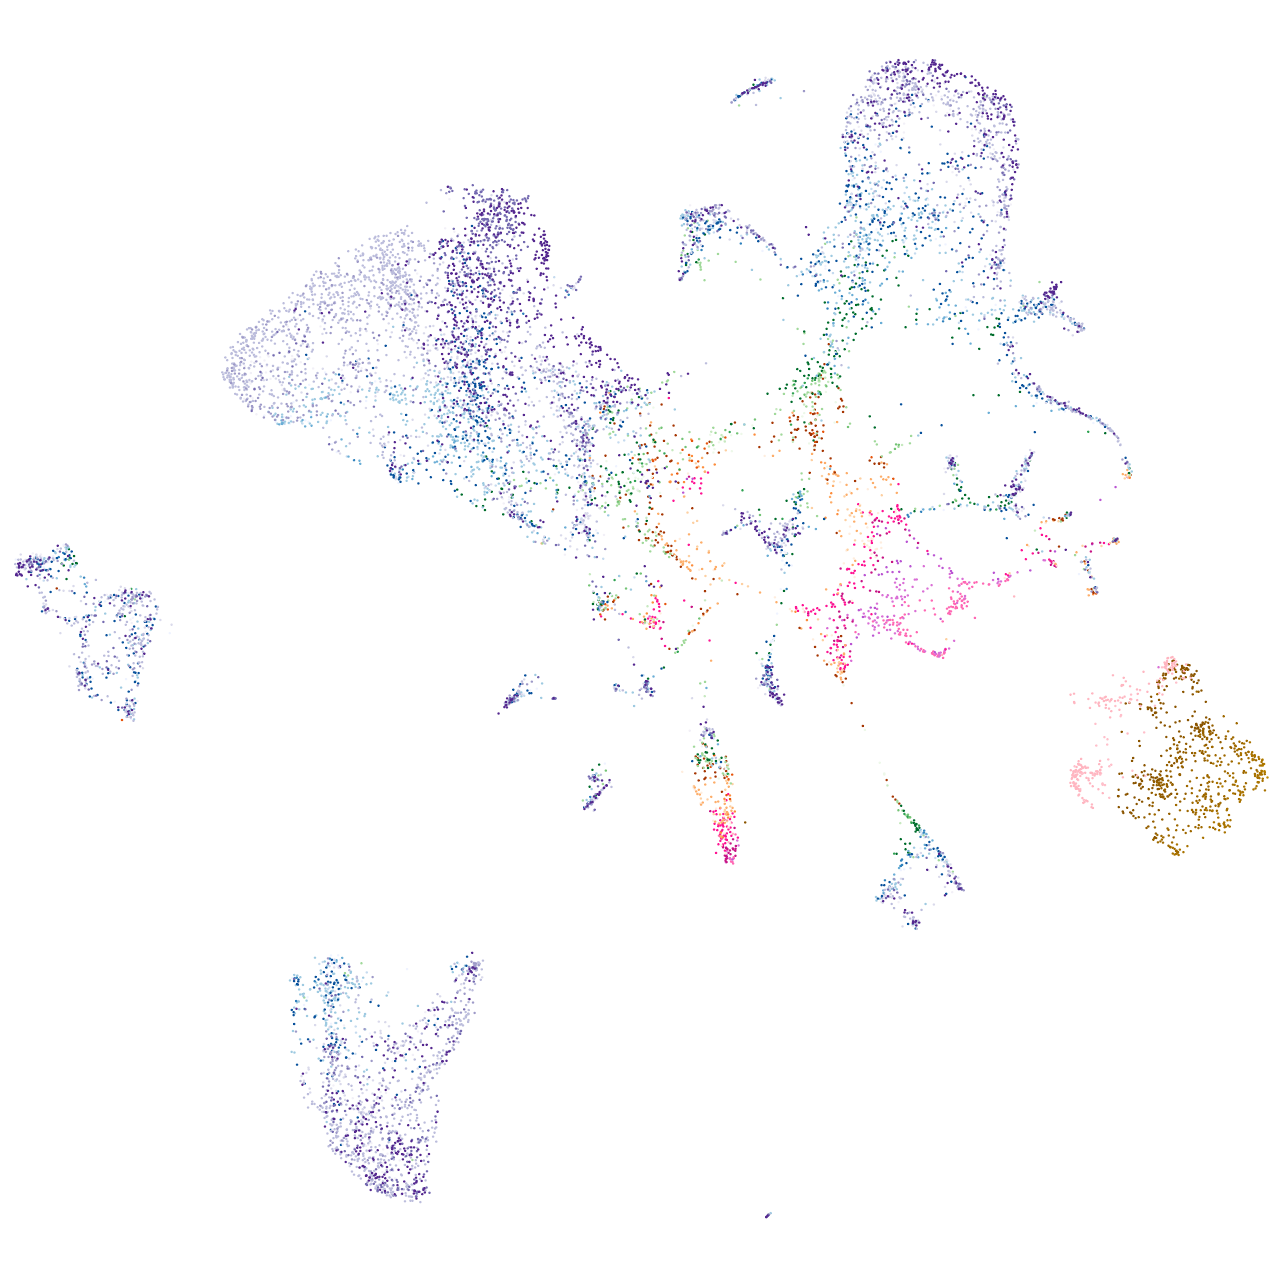


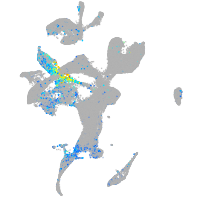
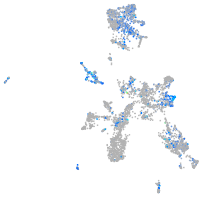
Expression by stage/cluster
Correlated gene expression
| Positive correlation | Negative correlation | ||
| Gene | r | Gene | r |
| bcam | 0.358 | gapdh | -0.333 |
| cd9b | 0.348 | apoc2 | -0.320 |
| marcksl1a | 0.332 | apoa4b.1 | -0.317 |
| epcam | 0.326 | afp4 | -0.304 |
| tpm4a | 0.311 | gpx4a | -0.299 |
| cdh1 | 0.288 | scp2a | -0.298 |
| cldn7b | 0.283 | apoa1b | -0.294 |
| jpt1b | 0.283 | gamt | -0.294 |
| lama5 | 0.277 | fbp1b | -0.294 |
| foxp4 | 0.275 | gstt1a | -0.286 |
| CR383676.1 | 0.262 | aldob | -0.280 |
| f11r.1 | 0.260 | apobb.1 | -0.272 |
| hmga2 | 0.260 | sult2st2 | -0.270 |
| ywhaz | 0.257 | ahcy | -0.268 |
| spock3 | 0.256 | rdh1 | -0.264 |
| col2a1a | 0.256 | suclg1 | -0.263 |
| lsp1 | 0.253 | eno3 | -0.262 |
| cldnb | 0.250 | msrb2 | -0.262 |
| abca12 | 0.249 | pklr | -0.259 |
| pmp22b | 0.248 | apoa2 | -0.258 |
| idh2 | 0.247 | dhrs9 | -0.258 |
| meis1b | 0.244 | slco1d1 | -0.255 |
| flot2a | 0.241 | ugt1a7 | -0.253 |
| sdc4 | 0.241 | tdo2a | -0.252 |
| sgms1 | 0.241 | mdh1aa | -0.251 |
| cnn2 | 0.240 | gatm | -0.250 |
| notch3 | 0.240 | etnppl | -0.250 |
| ptprfb | 0.238 | mgst1.2 | -0.250 |
| tgfb3 | 0.238 | apom | -0.248 |
| si:ch211-264f5.6 | 0.238 | gcshb | -0.248 |
| h3f3a | 0.238 | zgc:123103 | -0.248 |
| glulb | 0.237 | pla2g12b | -0.247 |
| ubc | 0.236 | fabp10a | -0.246 |
| rpz5 | 0.236 | si:dkey-16p21.8 | -0.246 |
| hmgb3a | 0.236 | ftcd | -0.246 |