Daniocell
aifm2 (epidermis)
apoptosis inducing factor mitochondria associated 2
ZFIN
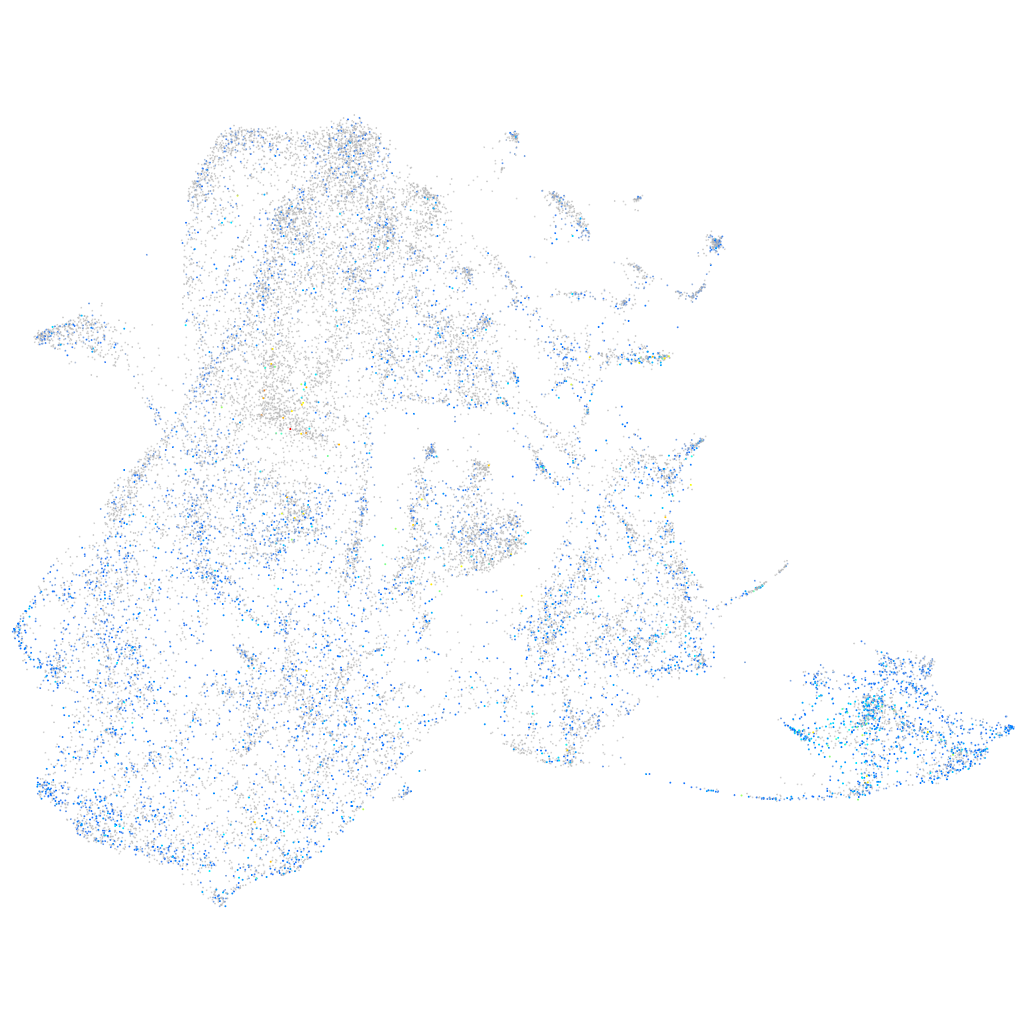
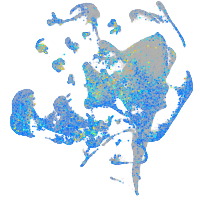
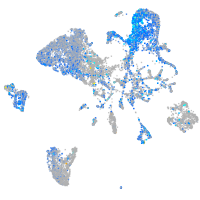
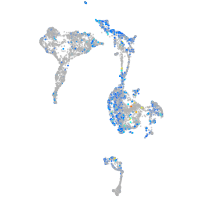
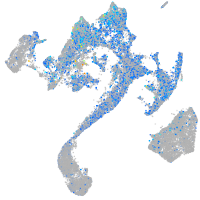
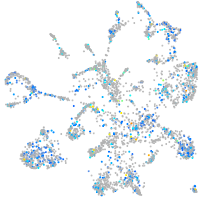
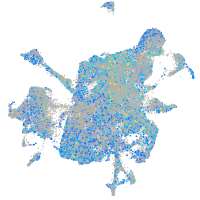
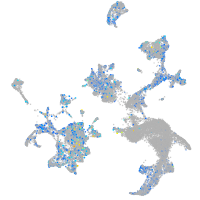
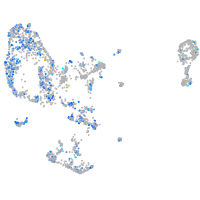
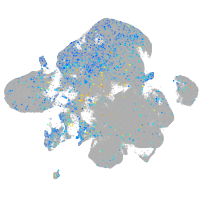
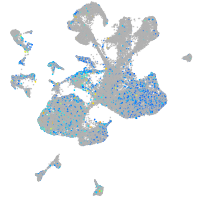
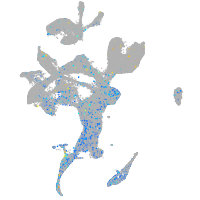
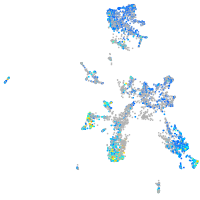
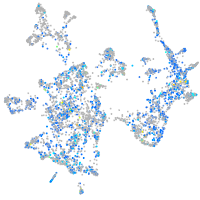
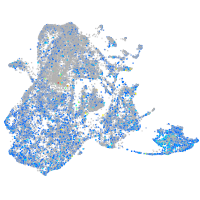
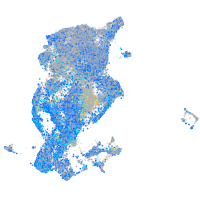
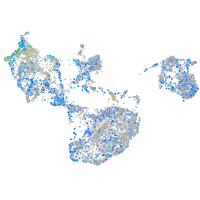
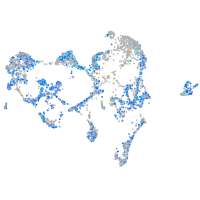
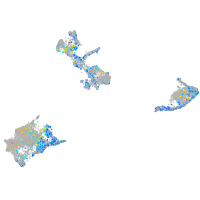
Gene expression UMAP
Display:
Expression
Stage
Other cell groups
all cells
blastomeres
PGCs
endoderm
axial mesoderm
muscle
mural cells /
non-skeletal muscle
mesenchyme
hematopoietic /
vasculature
pronephros
neural
spinal cord / glia
eye
taste / olfactory
otic / lateral line
epidermis
periderm
fin
ionocytes / mucous
pigment cells
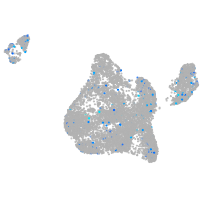
Expression by stage/cluster
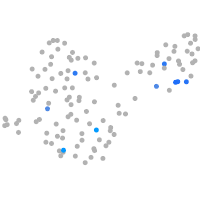
Correlated gene expression
Positive correlation
Negative correlation
Gene
r
Gene
r
si:ch73-347e22.8
0.238
rbp4
-0.194
si:dkey-87o1.2
0.237
krt5
-0.191
krt92
0.236
col1a1b
-0.187
cldne
0.223
col1a2
-0.185
si:ch211-157c3.4
0.223
krtt1c19e
-0.181
si:ch73-204p21.2
0.223
zgc:136930
-0.179
zgc:153665
0.223
si:dkey-33c14.3
-0.179
anxa1c
0.220
sparc
-0.172
anxa1b
0.219
krt91
-0.170
agr1
0.218
col1a1a
-0.170
cldn23a
0.217
si:dkey-183i3.5
-0.170
nqo1
0.217
tmsb4x
-0.167
stard14
0.216
wu:fa03e10
-0.155
zgc:165423
0.216
col11a1a
-0.154
cd9b
0.215
col17a1a
-0.154
lye
0.214
col14a1b
-0.153
hsd17b12a
0.213
postnb
-0.153
ANXA1 (1 of many)
0.212
lgals1l1
-0.153
stx11b.1
0.212
si:dkey-16p21.8
-0.147
scel
0.210
col2a1b
-0.146
styk1b
0.208
cxl34b.11
-0.145
evplb
0.207
cldn1
-0.137
selenow2b
0.205
CABZ01044281.1
-0.131
capn9
0.203
pfn1
-0.130
krt1-19d
0.203
aep1
-0.129
s100w
0.203
si:ch211-39i22.1
-0.129
gmds
0.202
itgb4
-0.128
gale
0.202
zgc:77439
-0.128
arl11
0.201
ptgdsb.1
-0.122
si:ch211-195b11.3
0.201
ecrg4b
-0.116
gbgt1l4
0.200
cotl1
-0.116
zgc:110333
0.199
itgb1b.2
-0.116
dhrs13a.2
0.199
col5a1
-0.113
evpla
0.199
epgn
-0.112
tprg1
0.198
itgb3a
-0.111