Daniocell
ahi1 (periderm)
Abelson helper integration site 1
ZFIN
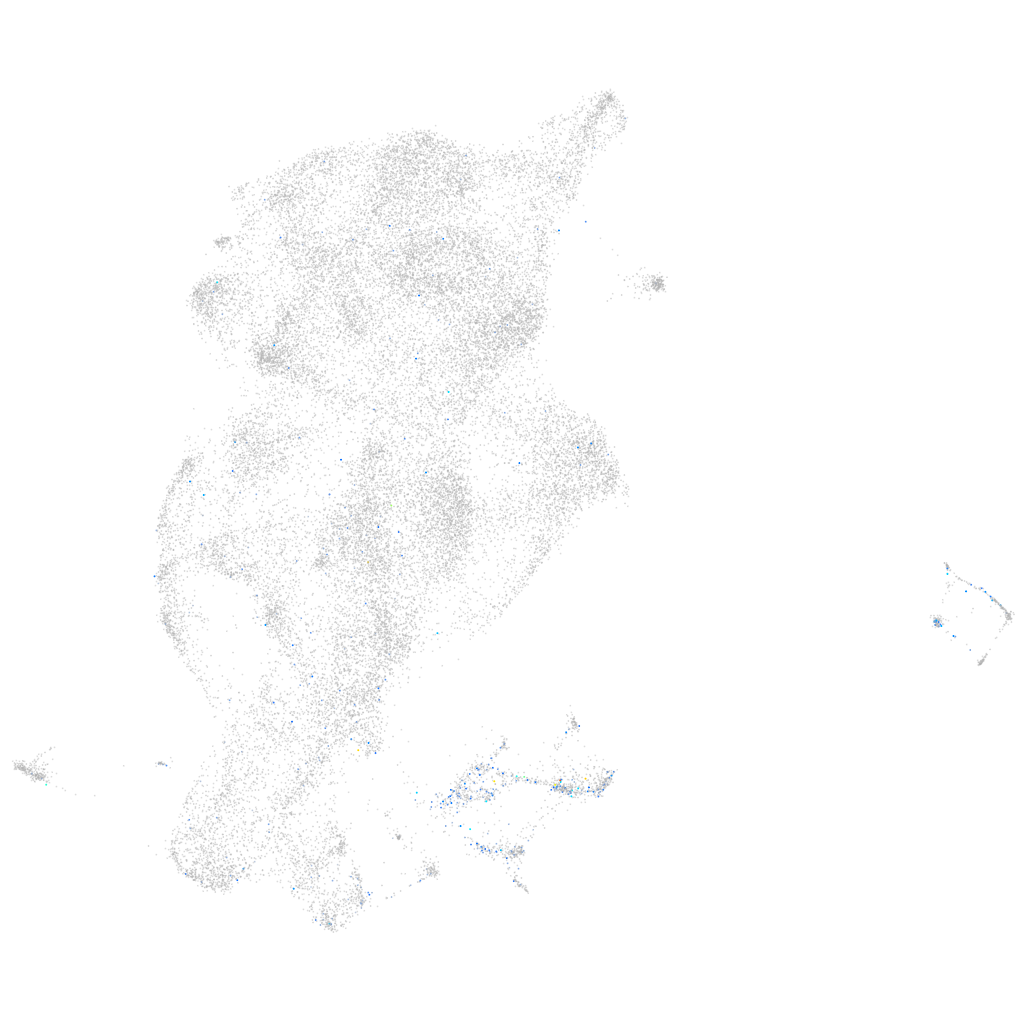
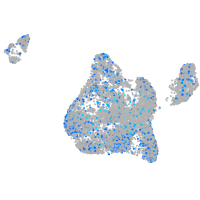
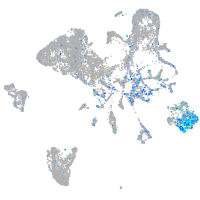
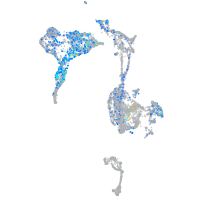
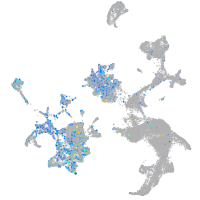
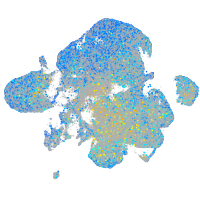
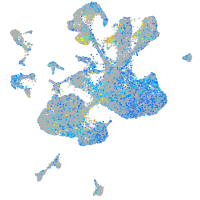
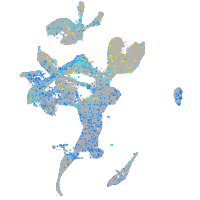
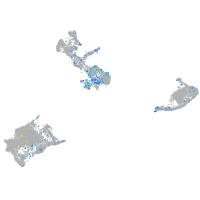
Gene expression UMAP
Display:
Expression
Stage
Other cell groups
all cells
blastomeres
PGCs
endoderm
axial mesoderm
muscle
mural cells /
non-skeletal muscle
mesenchyme
hematopoietic /
vasculature
pronephros
neural
spinal cord / glia
eye
taste / olfactory
otic / lateral line
epidermis
periderm
fin
ionocytes / mucous
pigment cells
Expression by stage/cluster
Correlated gene expression
Positive correlation
Negative correlation
Gene
r
Gene
r
acot21
0.180
cyt1
-0.094
BX539307.1
0.170
si:ch211-195b11.3
-0.090
gfra1b
0.167
icn2
-0.088
tshz3b
0.165
wu:fb18f06
-0.072
nova2
0.160
selenow1
-0.069
si:ch211-222l21.1
0.158
krt4
-0.068
si:dkey-21e5.1
0.156
rplp2
-0.063
si:ch73-383g2.1
0.156
icn
-0.060
hmgb1b
0.154
scel
-0.059
sox11b
0.153
cfl1l
-0.058
marcksl1a
0.151
cyt1l
-0.058
si:ch211-137a8.4
0.149
anxa1a
-0.057
si:ch211-133n4.4
0.146
si:ch211-207n23.2
-0.057
si:ch211-215m21.22
0.146
zgc:193505
-0.056
msna
0.144
krtt1c19e
-0.056
tmeff1b
0.141
aldob
-0.056
ebf3a
0.139
eef1da
-0.055
LECT2 (1 of many)
0.139
pycard
-0.053
mex3b
0.138
si:dkeyp-51b9.3
-0.053
marcksa
0.138
tcnbb
-0.053
mmp16b
0.138
s100a10b
-0.052
gpm6aa
0.136
selenow2b
-0.049
marcksl1b
0.135
abcb5
-0.048
CR788285.1
0.131
zgc:162730
-0.046
elavl3
0.130
wu:fa03e10
-0.046
tspoap1
0.130
rps29
-0.046
cd81a
0.129
si:ch211-105c13.3
-0.045
LOC108190449
0.129
capns1a
-0.045
b4galnt3a
0.129
s100w
-0.044
ap1s2
0.129
si:ch73-52f15.5
-0.044
c1qtnf1
0.128
krt17
-0.044
anos1a
0.127
tlcd1
-0.043
LOC101887156
0.127
s100v2
-0.043
tmem198a
0.126
tdh
-0.042
tfec
0.126
rps10
-0.042