
agrin
ZFIN 
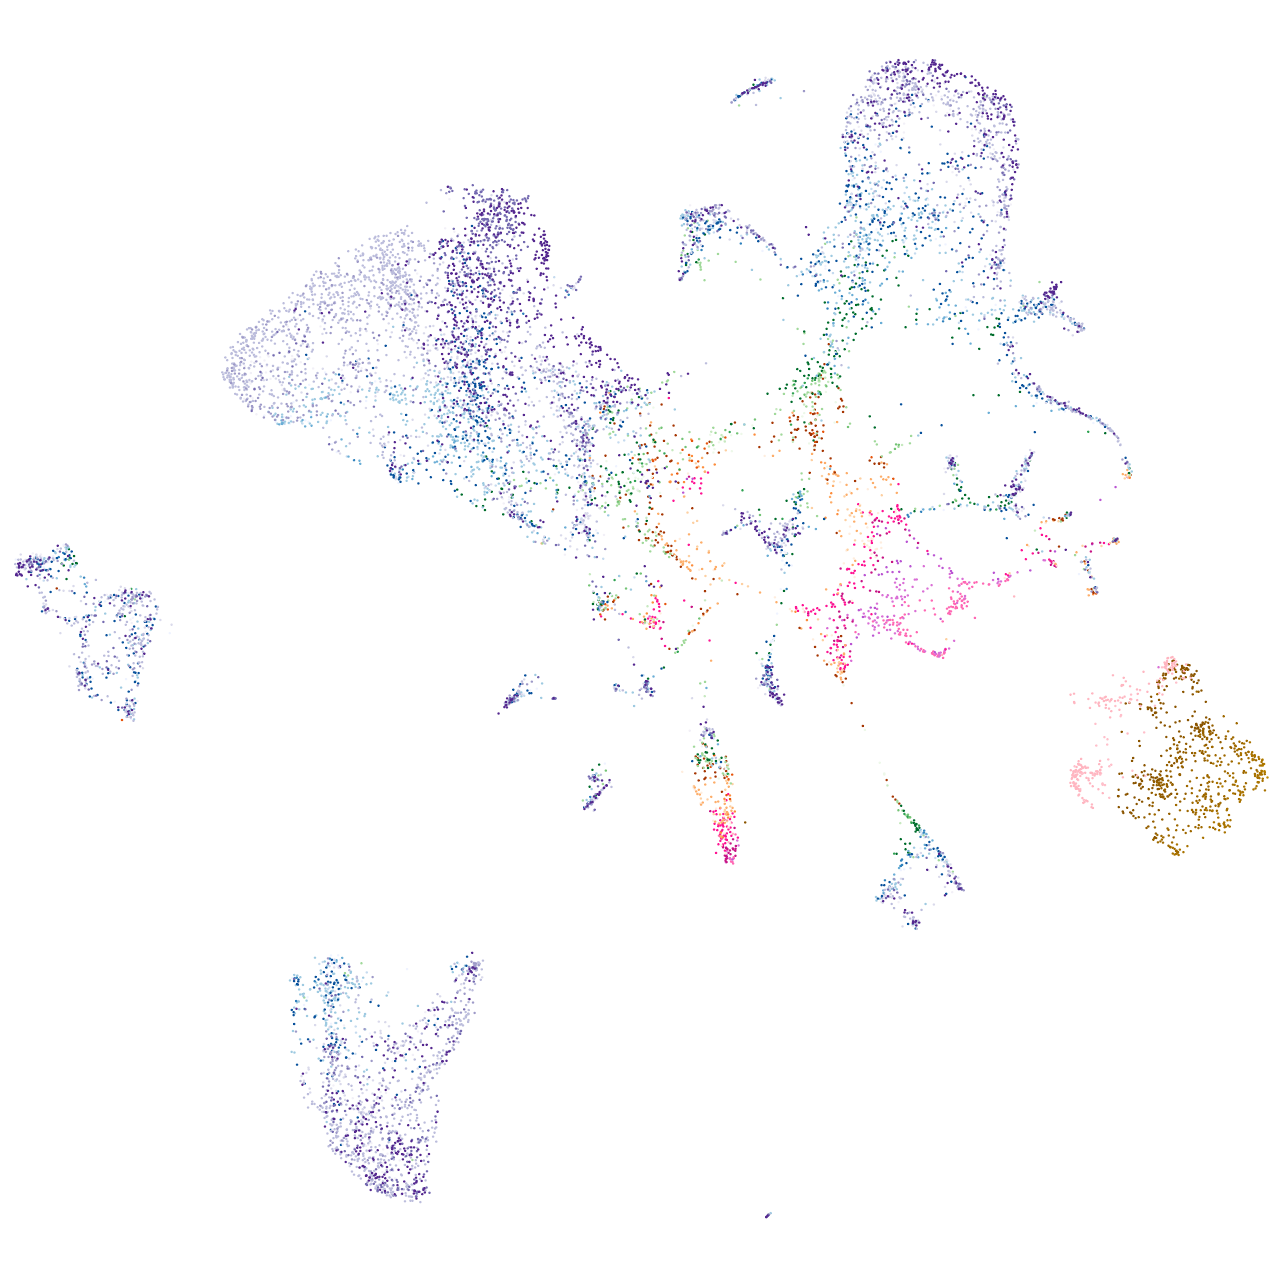
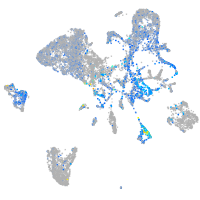
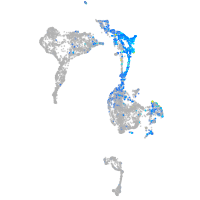
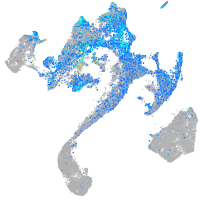
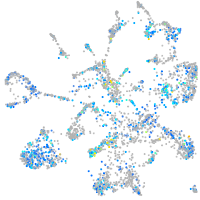
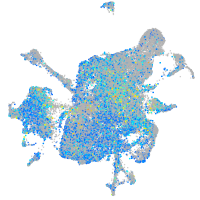
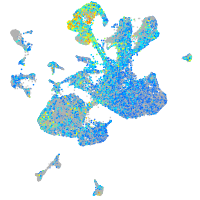
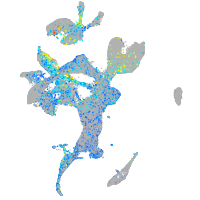
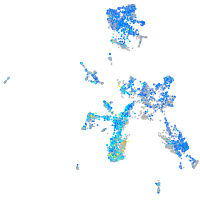
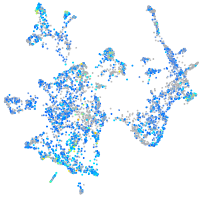
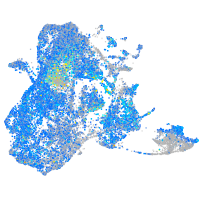
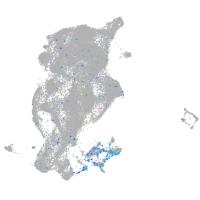
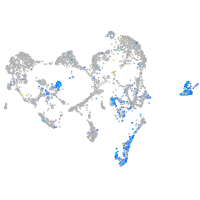
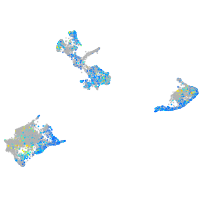
Gene expression UMAP


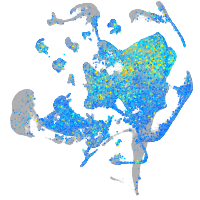
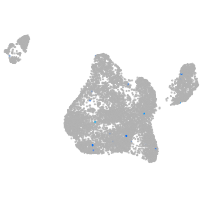
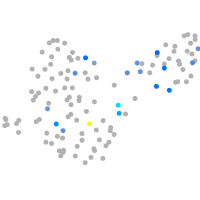
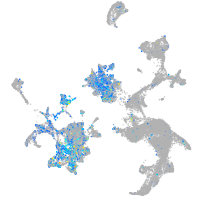

Expression by stage/cluster
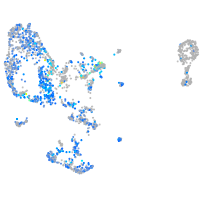
Correlated gene expression
| Positive correlation | Negative correlation | ||
| Gene | r | Gene | r |
| bcam | 0.463 | gatm | -0.235 |
| lama5 | 0.460 | gamt | -0.227 |
| col18a1a | 0.432 | bhmt | -0.227 |
| pmp22b | 0.399 | gapdh | -0.200 |
| marcksl1a | 0.382 | mat1a | -0.195 |
| sim1b | 0.377 | aqp12 | -0.194 |
| cd9b | 0.372 | agxtb | -0.183 |
| anxa3b | 0.368 | pnp4b | -0.181 |
| b3gnt5a | 0.363 | apoc1 | -0.170 |
| ahnak | 0.358 | ahcy | -0.169 |
| f3a | 0.356 | dap | -0.163 |
| col4a5 | 0.352 | grhprb | -0.160 |
| lamc1 | 0.351 | fbp1b | -0.158 |
| CABZ01055365.1 | 0.349 | apoa1b | -0.157 |
| epcam | 0.349 | prss1 | -0.156 |
| col4a6 | 0.348 | afp4 | -0.153 |
| sparc | 0.347 | prss59.2 | -0.152 |
| foxp4 | 0.347 | gpx4a | -0.151 |
| ctgfa | 0.346 | CELA1 (1 of many) | -0.150 |
| abca12 | 0.343 | cel.1 | -0.150 |
| vwa1 | 0.340 | cpb1 | -0.150 |
| arhgap29b | 0.338 | sycn.2 | -0.150 |
| ihha | 0.332 | prss59.1 | -0.149 |
| mxra8b | 0.331 | apoa2 | -0.149 |
| dag1 | 0.330 | apoda.2 | -0.149 |
| cabp2b | 0.329 | apoa4b.1 | -0.149 |
| cldnc | 0.328 | ctrb1 | -0.149 |
| fgfr2 | 0.328 | pdia2 | -0.148 |
| erbb3a | 0.328 | zgc:112160 | -0.148 |
| spock3 | 0.325 | ela3l | -0.148 |
| cav1 | 0.324 | cel.2 | -0.148 |
| spns2 | 0.323 | kng1 | -0.148 |
| gstm.3 | 0.321 | cpa5 | -0.147 |
| spaca4l | 0.321 | erp27 | -0.147 |
| cnn2 | 0.320 | si:ch211-240l19.5 | -0.147 |