Daniocell
adnpb (mural cells / non-skeletal muscle)
activity-dependent neuroprotector homeobox b
ZFIN
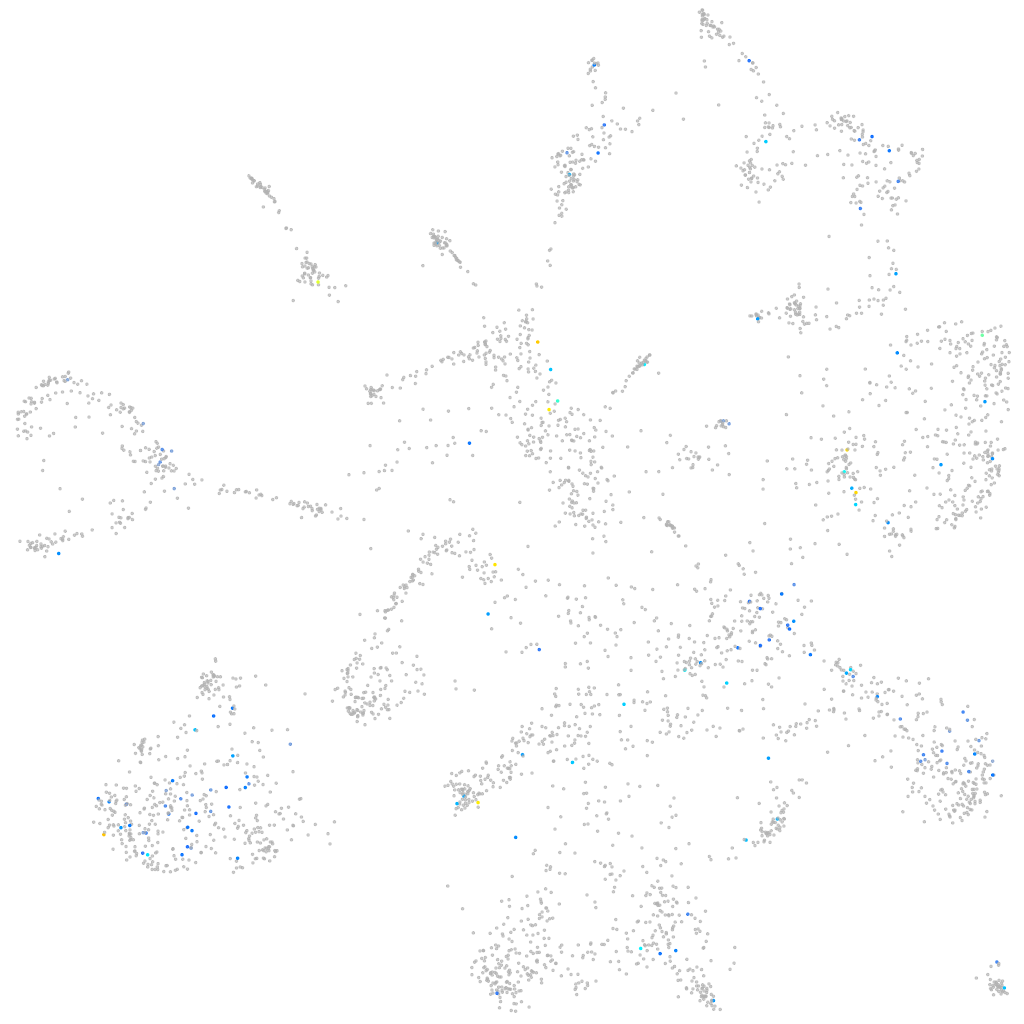
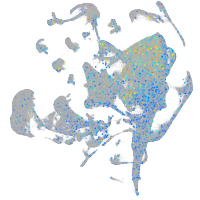
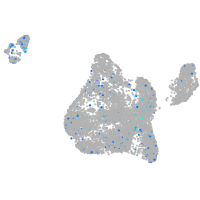
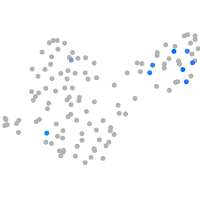
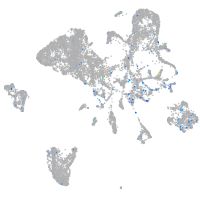
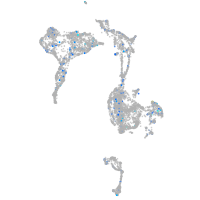
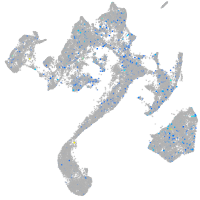
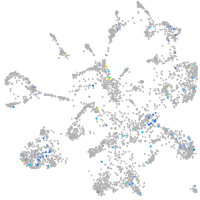
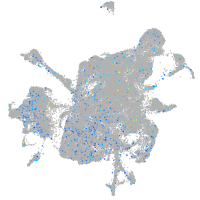
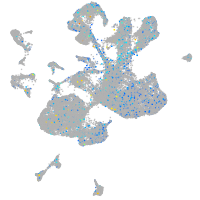
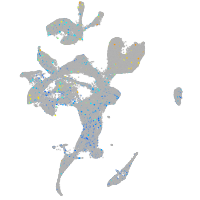
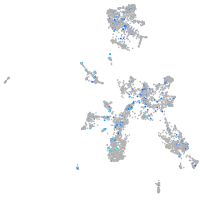
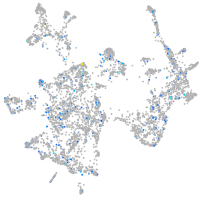
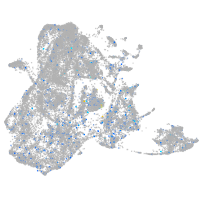
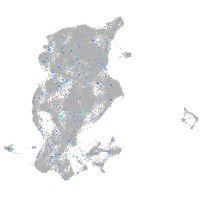
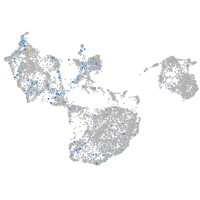
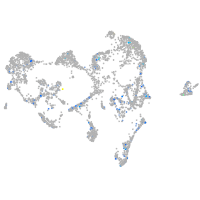
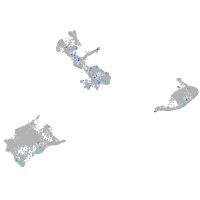
Gene expression UMAP
Display:
Expression
Stage
Other cell groups
all cells
blastomeres
PGCs
endoderm
axial mesoderm
muscle
mural cells /
non-skeletal muscle
mesenchyme
hematopoietic /
vasculature
pronephros
neural
spinal cord / glia
eye
taste / olfactory
otic / lateral line
epidermis
periderm
fin
ionocytes / mucous
pigment cells
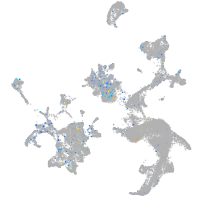
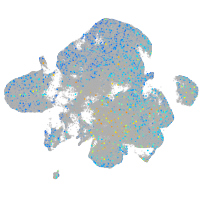
Expression by stage/cluster
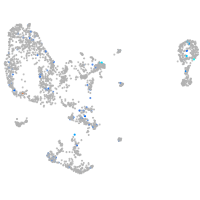
Correlated gene expression
Positive correlation
Negative correlation
Gene
r
Gene
r
si:dkey-9i23.14
0.205
krt91
-0.046
CT573793.3
0.203
acta2
-0.045
has1
0.199
aoc2
-0.041
smc1b
0.197
serpine2
-0.041
CABZ01030006.1
0.188
zgc:92606
-0.041
XLOC-026004
0.186
fxyd1
-0.040
LOC101886132
0.186
eef1b2
-0.040
rell2
0.179
serf2
-0.038
XLOC-001298
0.179
rpl31
-0.037
LOC101883642
0.174
tob1b
-0.037
styk1a
0.172
cav2
-0.037
si:dkey-88l16.3
0.171
rpl10a
-0.037
XLOC-002521
0.169
ela2l
-0.036
si:ch73-367f21.5
0.168
rpl23
-0.036
si:zfos-375h5.1
0.168
apoa1b
-0.036
map1lc3cl
0.164
ghrb
-0.036
znf1037
0.164
mylz3
-0.035
tdrd6
0.164
wnt11r
-0.035
itih5
0.152
ckba
-0.035
ankrd13b
0.136
col6a2
-0.035
LOC103910179
0.134
phlda3
-0.034
BX088712.2
0.134
lmod1b
-0.034
si:rp71-39b20.4
0.127
nid1a
-0.034
psmb12
0.127
ifitm1
-0.034
LOC110439549
0.126
id3
-0.034
tulp1a
0.126
pvalb1
-0.034
galr2b
0.124
zgc:112160
-0.033
taar18d
0.124
tnnc2
-0.033
LOC100332698
0.119
aldob
-0.033
si:dkey-16p6.1
0.119
ehmt1a
-0.033
LOC108183534
0.118
cxcl14
-0.032
ghrhra
0.117
tpd52l2b
-0.032
prlh
0.117
cpxm1a
-0.032
FO704836.1
0.117
prss59.2
-0.032
tnni2a.3
0.117
sypl1
-0.032