Daniocell
adcyap1a (eye)
adenylate cyclase activating polypeptide 1a
ZFIN
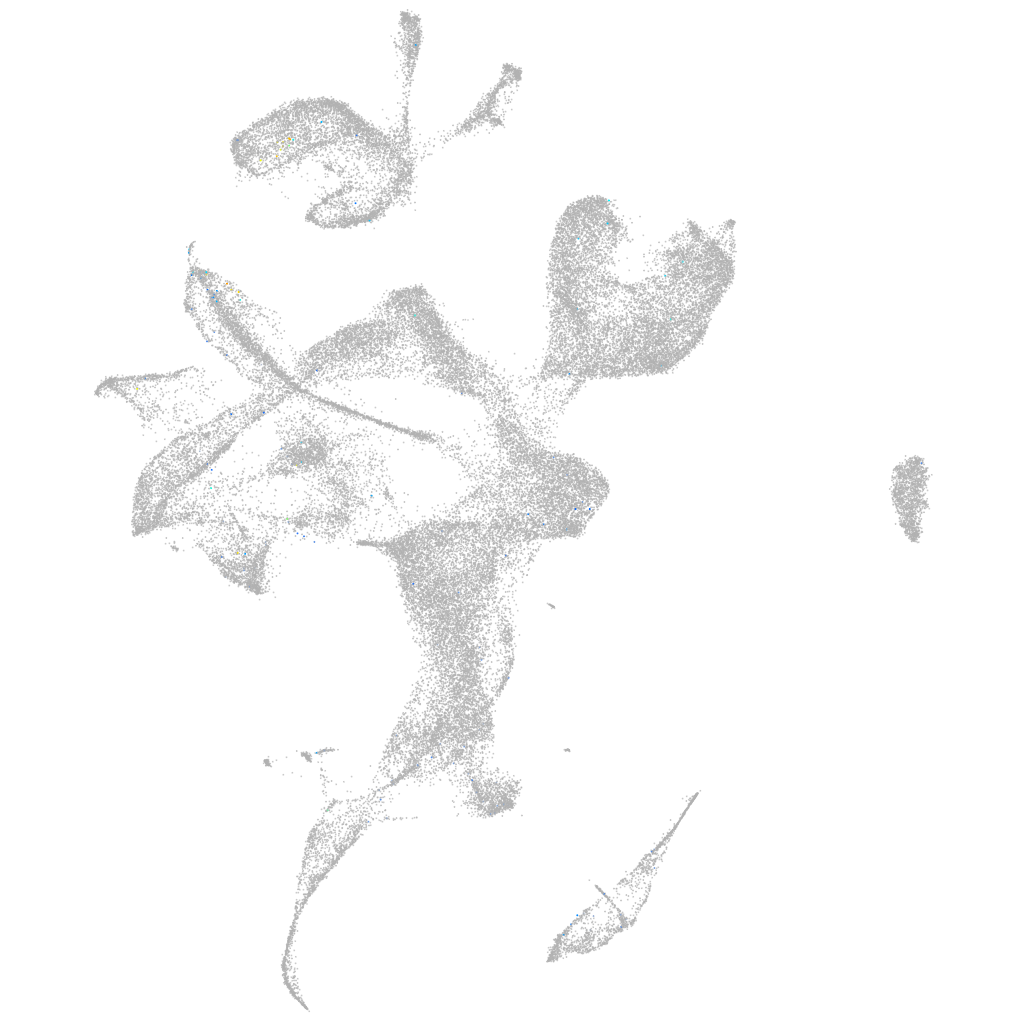
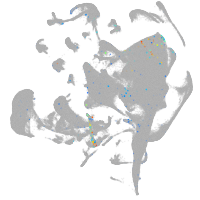
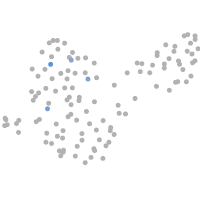
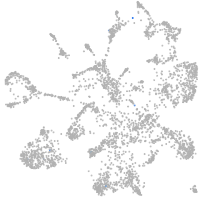
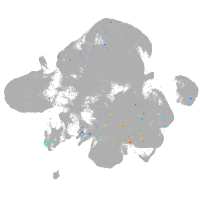
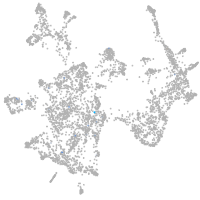
Gene expression UMAP
Display:
Expression
Stage
Other cell groups
all cells
blastomeres
PGCs
endoderm
axial mesoderm
muscle
mural cells /
non-skeletal muscle
mesenchyme
hematopoietic /
vasculature
pronephros
neural
spinal cord / glia
eye
taste / olfactory
otic / lateral line
epidermis
periderm
fin
ionocytes / mucous
pigment cells
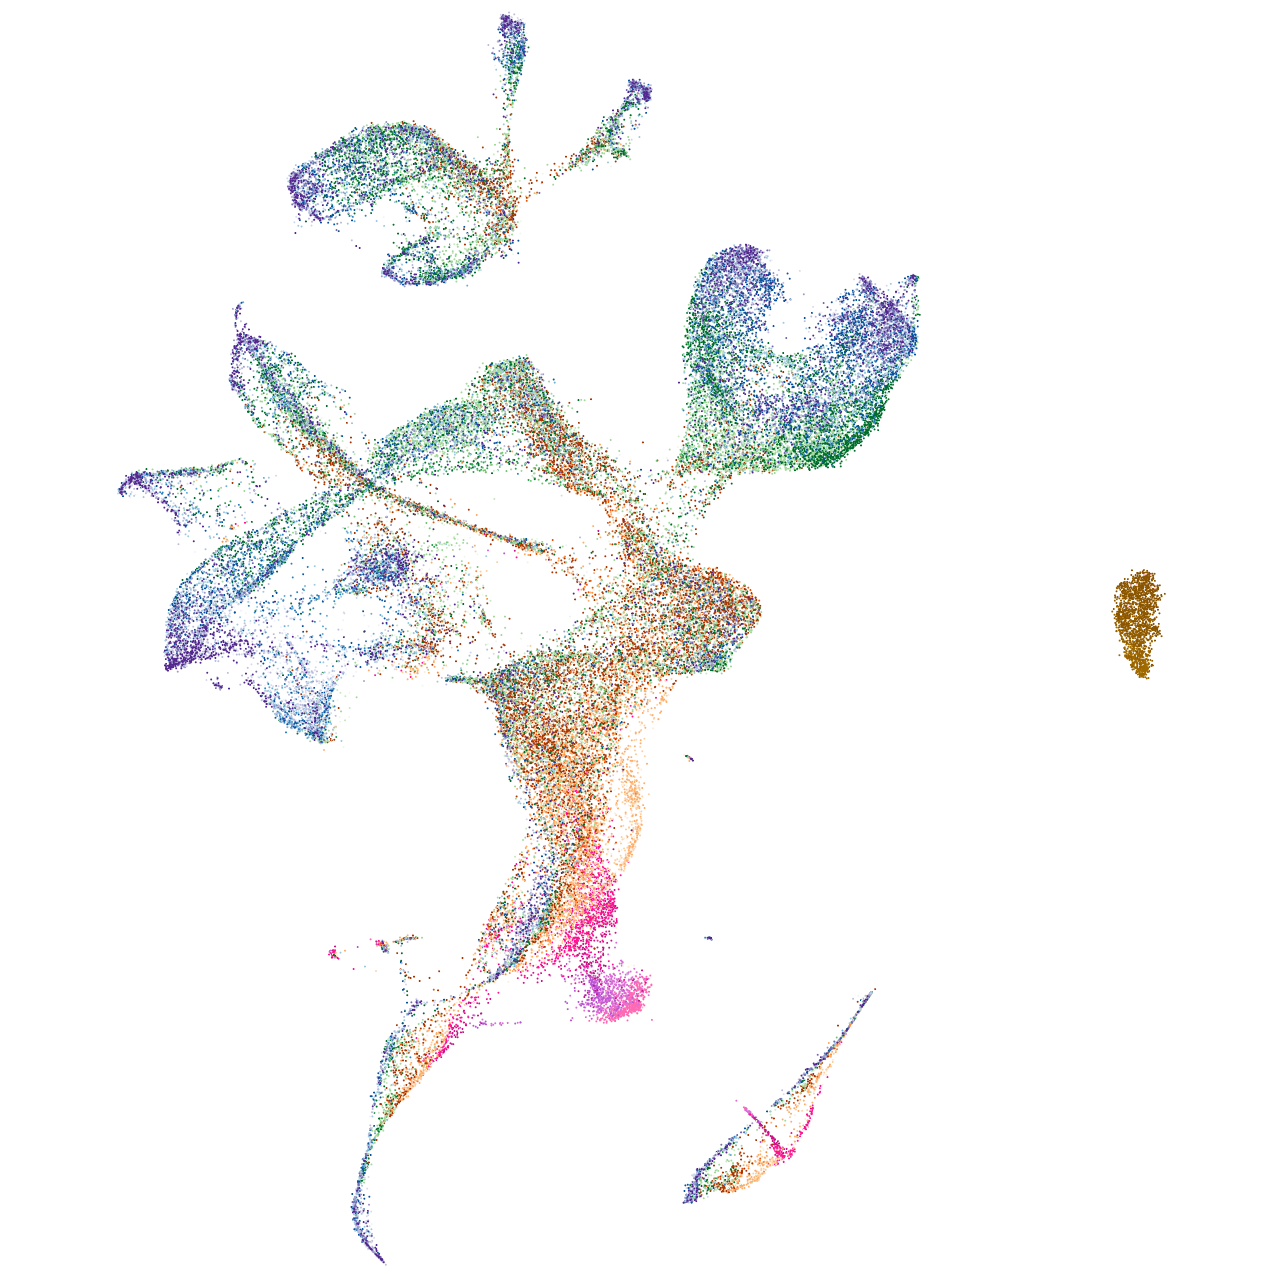
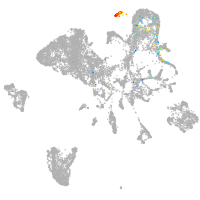
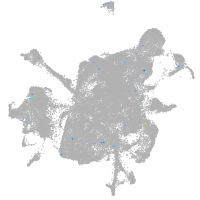
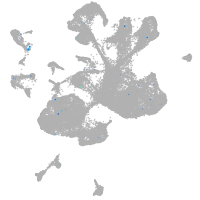
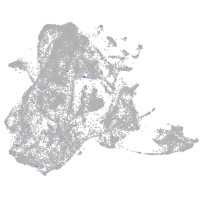
Expression by stage/cluster
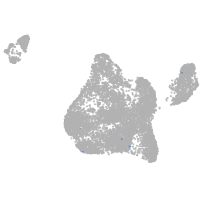
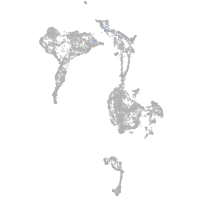
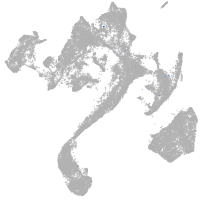
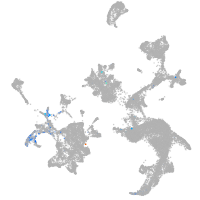
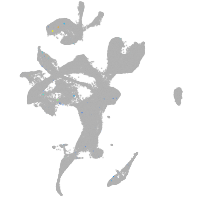
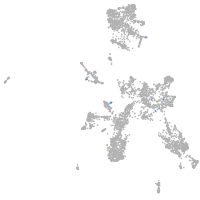
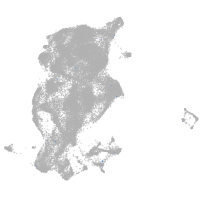
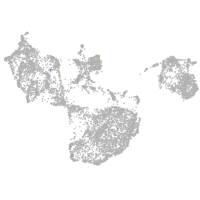
Correlated gene expression
Positive correlation
Negative correlation
Gene
r
Gene
r
npb
0.195
hmgb2a
-0.027
rasal1a
0.177
ahcy
-0.019
CT573366.1
0.153
stmn1a
-0.019
TCIM (1 of many)
0.141
rpl10
-0.019
si:ch211-216b21.2
0.136
cx43.4
-0.018
LOC103910498
0.131
ptmab
-0.017
or129-1
0.111
rpl22l1
-0.016
CT009597.1
0.105
zgc:56493
-0.016
LOC110439945
0.105
baz1a
-0.016
gria2b
0.086
hmga1a
-0.016
igf2a
0.086
si:dkey-151g10.6
-0.016
LOC571123
0.086
rrm1
-0.015
c2cd4a
0.080
rpl15
-0.015
trarg1a
0.080
eif3m
-0.015
frem2a
0.079
rpsa
-0.015
LOC103909694
0.077
rps6
-0.015
stmn4
0.074
btg1
-0.015
si:ch211-180f4.1
0.073
rps19
-0.015
grin2ab
0.071
mibp
-0.015
pimr109
0.071
zgc:110425
-0.015
lrrc3ca
0.070
CABZ01005379.1
-0.015
LOC110438543
0.069
brd3a
-0.015
kcna2a
0.067
ccna2
-0.015
cd40
0.066
lbr
-0.014
si:dkeyp-117b11.1
0.066
rps12
-0.014
CABZ01080371.3
0.066
tmpob
-0.014
BX927317.3
0.065
hmgb2b
-0.014
cplx2
0.065
anp32e
-0.014
irx4a
0.065
rps26
-0.014
LOC110439620
0.064
XLOC-003689
-0.014
LOC100537342
0.063
tpt1
-0.014
gabrz
0.063
rpl4
-0.014
FQ377605.1
0.062
pcna
-0.014
si:dkey-202e22.2
0.062
rtca
-0.014
si:dkeyp-72g9.4
0.061
rps20
-0.014