Daniocell
actc1c (periderm)
actin alpha cardiac muscle 1c
ZFIN
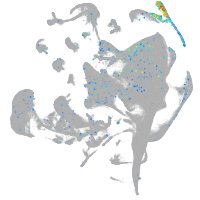
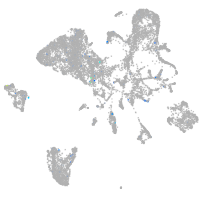
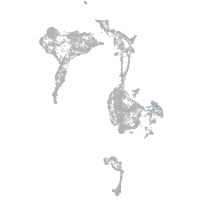
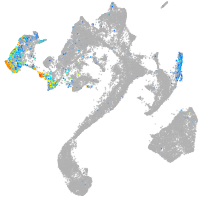
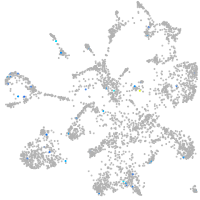
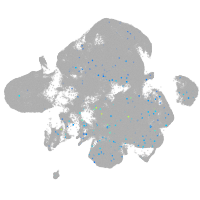
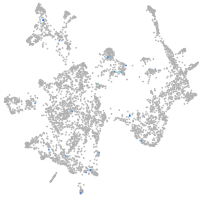
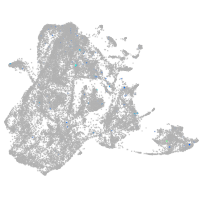
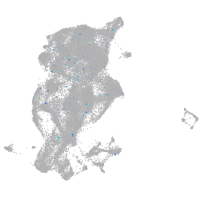
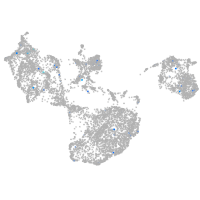
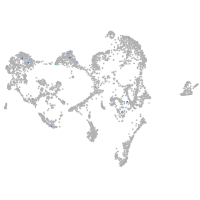
Gene expression UMAP
Display:
Expression
Stage
Other cell groups
all cells
blastomeres
PGCs
endoderm
axial mesoderm
muscle
mural cells /
non-skeletal muscle
mesenchyme
hematopoietic /
vasculature
pronephros
neural
spinal cord / glia
eye
taste / olfactory
otic / lateral line
epidermis
periderm
fin
ionocytes / mucous
pigment cells
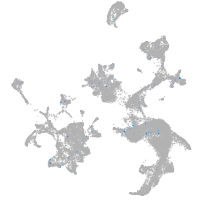
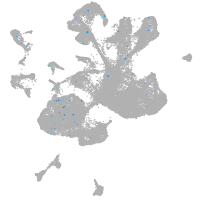
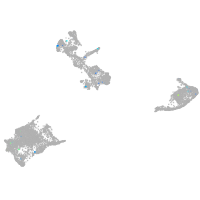
Expression by stage/cluster
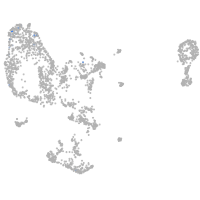
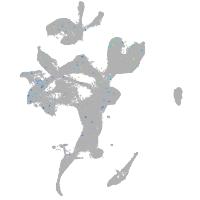
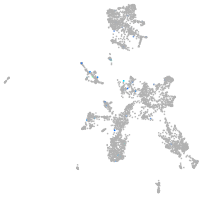
Correlated gene expression
Positive correlation
Negative correlation
Gene
r
Gene
r
LOC100332004
0.117
zgc:193505
-0.034
lrp2bp
0.112
agr1
-0.033
CU693446.1
0.101
zgc:175088
-0.032
BX897691.1
0.094
krt5
-0.031
cryabb
0.092
zgc:163030
-0.031
LOC100330744
0.090
anxa1a
-0.029
si:dkey-218h11.6
0.085
cox17
-0.028
si:dkeyp-2e4.8
0.081
btf3l4
-0.028
ssx2ipb
0.080
cst14b.1
-0.028
hrh2b
0.079
eif2s3
-0.027
BX855614.2
0.078
anxa1b
-0.027
cdk21
0.077
ppib
-0.027
hnf4g
0.075
serp1
-0.027
LOC100536676
0.072
eif3g
-0.027
LOC108183335
0.071
ywhabl
-0.026
CR391991.3
0.070
sec61g
-0.026
nuggc.1
0.068
smdt1b
-0.026
LOC103909850
0.067
arl1
-0.026
RF01296
0.067
capns1b
-0.026
mlxipl
0.064
krt99
-0.025
BX571809.2
0.064
gmds
-0.025
znf1072
0.063
im:7150988
-0.025
si:ch211-284k5.2
0.062
capns1a
-0.024
LO017858.1
0.061
prdx5
-0.024
LOC110437999
0.059
eif4ebp3l
-0.024
havcr2
0.059
kdelr2b
-0.023
XLOC-031233
0.058
xbp1
-0.023
zgc:154055
0.058
srsf5a
-0.023
LOC108182290
0.058
zgc:174938
-0.023
si:ch211-181l5.2
0.058
copz2
-0.023
BX539313.2
0.057
BX901957.1
-0.023
BX284635.1
0.057
sem1
-0.022
impg1a
0.056
CABZ01087560.1
-0.022
XLOC-010593
0.055
s100v2
-0.022
zgc:113274
0.055
ctnnb2
-0.022