Daniocell
acot18 (ionocytes / mucous-producing)
acyl-CoA thioesterase 18
ZFIN
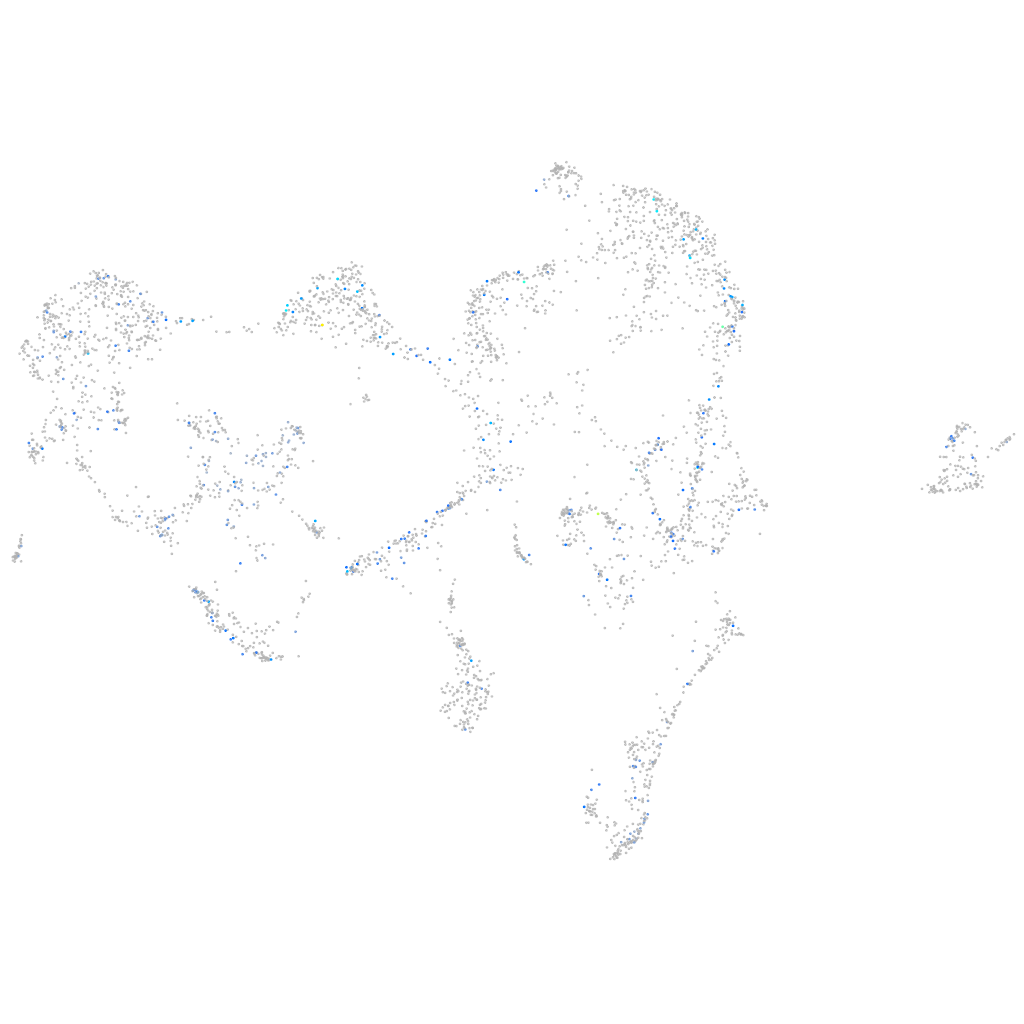
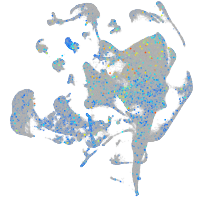
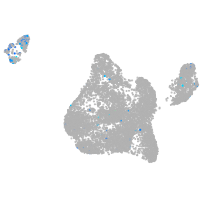
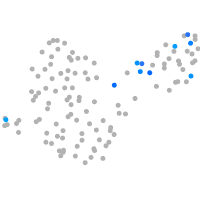
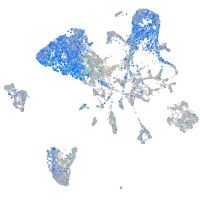
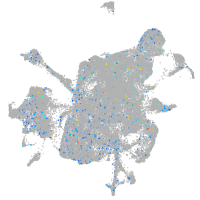
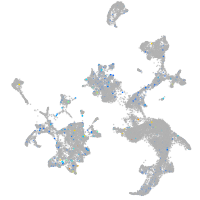
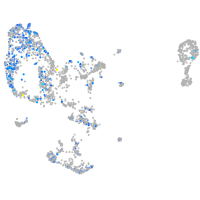
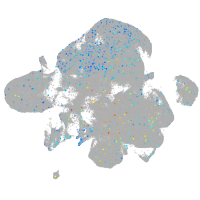
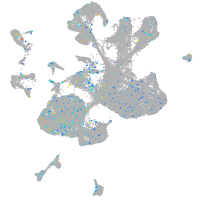
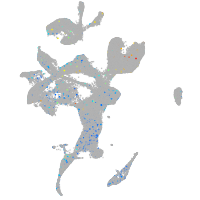
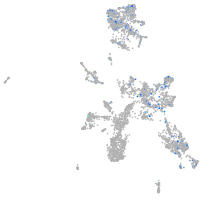
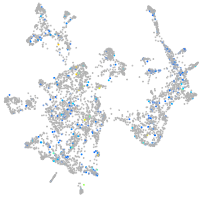
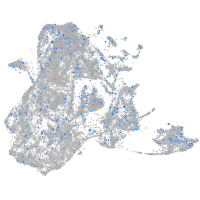
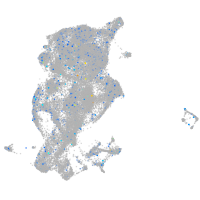
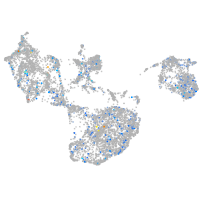
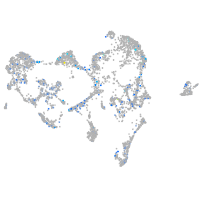
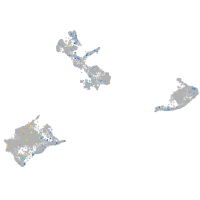
Gene expression UMAP
Display:
Expression
Stage
Other cell groups
all cells
blastomeres
PGCs
endoderm
axial mesoderm
muscle
mural cells /
non-skeletal muscle
mesenchyme
hematopoietic /
vasculature
pronephros
neural
spinal cord / glia
eye
taste / olfactory
otic / lateral line
epidermis
periderm
fin
ionocytes / mucous
pigment cells
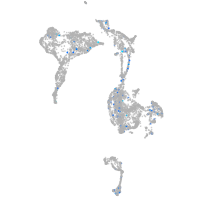
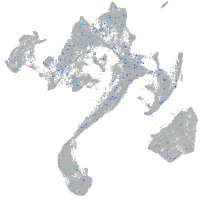
Expression by stage/cluster
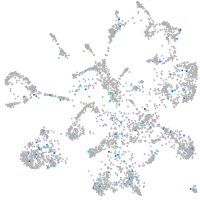
Correlated gene expression
Positive correlation
Negative correlation
Gene
r
Gene
r
soga3
0.162
rpl37
-0.052
si:dkey-20i20.4
0.157
znf395a
-0.047
gls2a
0.146
nr6a1a
-0.046
FRMD4A
0.133
si:dkey-151g10.6
-0.045
her3
0.130
nap1l4a
-0.044
XLOC-019753
0.128
apoc1
-0.044
tacr1a
0.124
slc38a5b
-0.043
chia.6
0.119
znf653
-0.040
LOC797949
0.119
slc43a2a
-0.040
XLOC-014188
0.118
trpm4b.2
-0.039
adal
0.115
ngfrb
-0.039
ripor3
0.114
trpm7
-0.038
CR925803.1
0.112
klf2b
-0.037
agbl4
0.111
BX927258.1
-0.037
klhl10b.1
0.110
pde7a
-0.037
si:dkeyp-71f10.5
0.108
si:dkey-184p18.2
-0.037
dtnbp1b
0.107
wwp2
-0.037
nkx2.9
0.106
rpl38
-0.036
XLOC-021301
0.105
XLOC-039121
-0.036
znf975
0.105
zgc:174938
-0.036
rnf150a
0.105
klf2a
-0.035
grn2
0.105
cyt1
-0.035
LOC101883154
0.104
greb1l
-0.035
LOC108190134
0.103
pdzrn3b
-0.035
BX321877.1
0.103
ccdc137
-0.034
gpr185b
0.102
acaca
-0.034
CT583726.1
0.101
dsc2l
-0.034
slitrk5b
0.101
slc16a12a
-0.034
tnnt1
0.101
rap1gap
-0.034
si:dkey-172k15.4
0.099
TSTA3 (1 of many)
-0.034
zgc:73359
0.099
abca1a
-0.034
si:ch73-158p21.2
0.097
cyt1l
-0.033
RF00007
0.097
scarb2a
-0.033
hyal6
0.097
zgc:174153
-0.033
tlr5b
0.097
atp2a1
-0.033