Daniocell
aagab (fin)
alpha and gamma adaptin binding protein
ZFIN
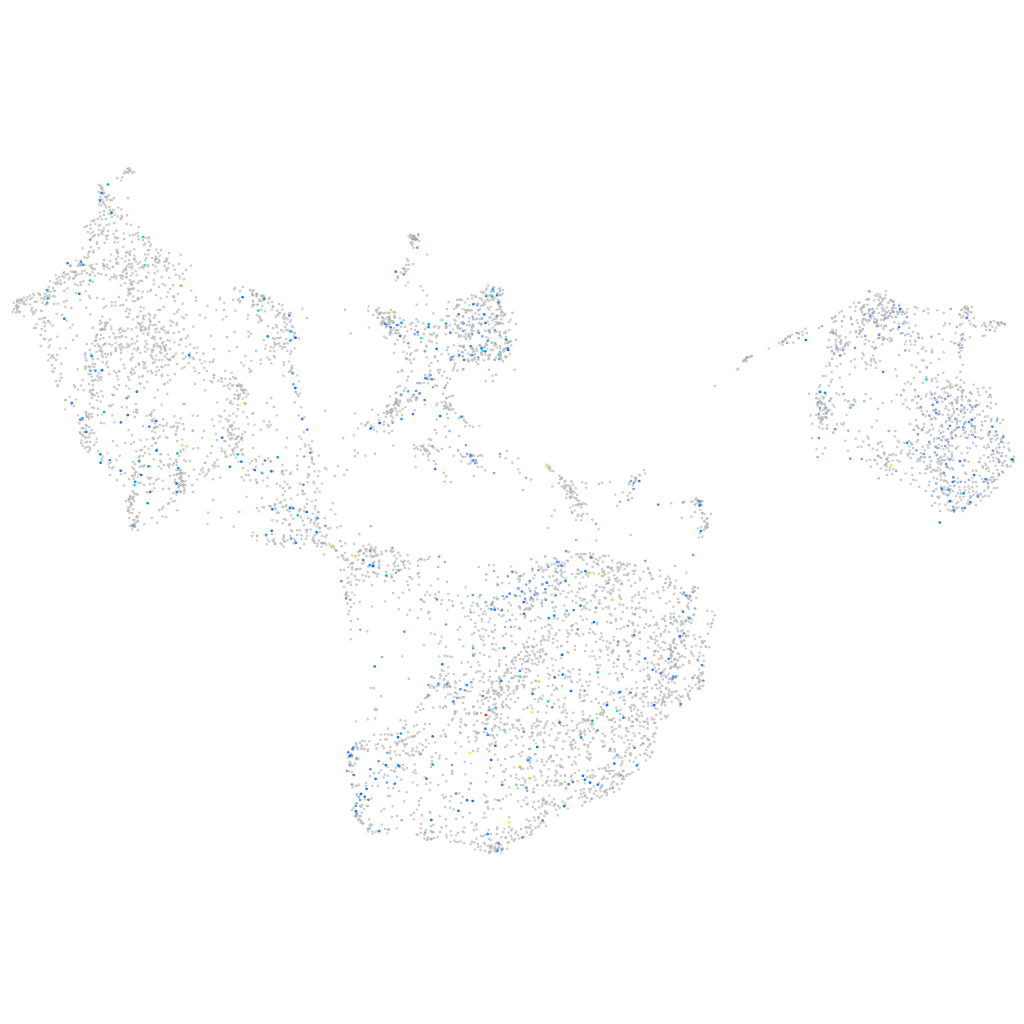
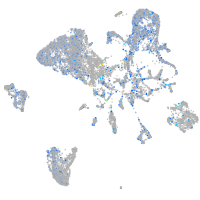
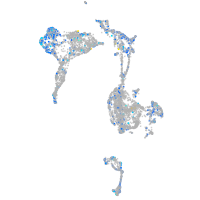
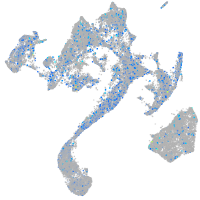
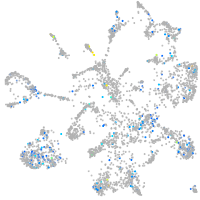
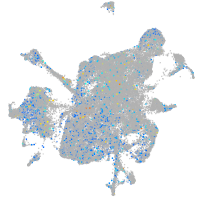
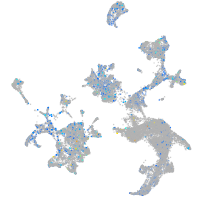
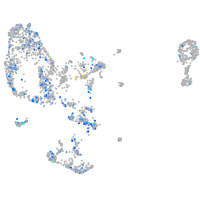
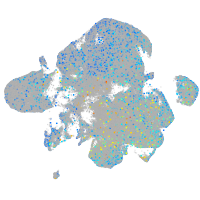
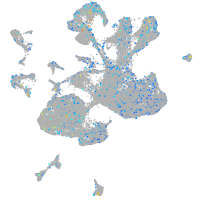
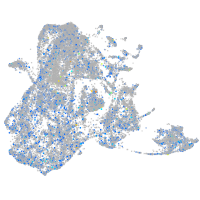
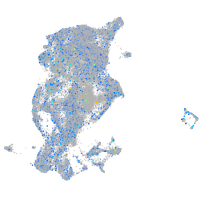
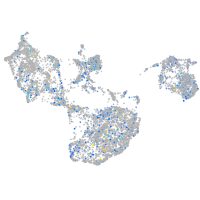
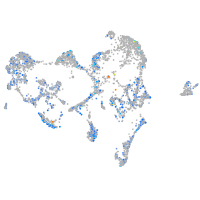
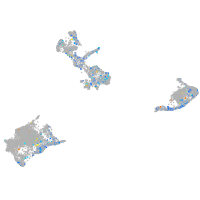
Gene expression UMAP
Display:
Expression
Stage
Other cell groups
all cells
blastomeres
PGCs
endoderm
axial mesoderm
muscle
mural cells /
non-skeletal muscle
mesenchyme
hematopoietic /
vasculature
pronephros
neural
spinal cord / glia
eye
taste / olfactory
otic / lateral line
epidermis
periderm
fin
ionocytes / mucous
pigment cells
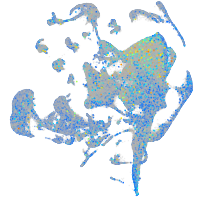
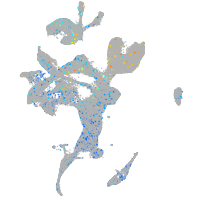
Expression by stage/cluster
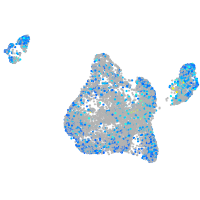
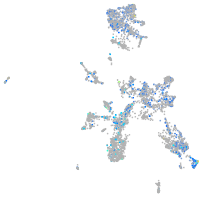
Correlated gene expression
Positive correlation
Negative correlation
Gene
r
Gene
r
BX936391.1
0.136
tat
-0.046
CR769769.3
0.119
fbln1
-0.045
asic1a
0.113
ecrg4a
-0.043
si:dkey-53k12.1
0.103
hgd
-0.042
znf1172
0.095
bhmt
-0.042
nr3c2
0.094
c1qtnf5
-0.041
rph3aa
0.094
LOC110439372
-0.040
LOC110440043
0.091
ttc36
-0.039
rbm8a
0.091
CABZ01092746.1
-0.038
CU695207.1
0.090
hpdb
-0.037
LOC108184012
0.090
ptx3a
-0.036
LOC110437825
0.089
fmoda
-0.036
gabrb1
0.086
rps19
-0.035
BX546500.1
0.086
zgc:114181
-0.035
allc
0.085
rpl38
-0.035
capza1b
0.085
ttn.2
-0.035
zgc:100906
0.085
mxra8a
-0.035
chrna10a
0.085
si:dkey-12l12.1
-0.035
si:ch211-63p21.8
0.084
spred2b
-0.033
XLOC-033352
0.084
pah
-0.033
stk38a
0.083
pcbd1
-0.033
gtf3ab
0.083
mt-co2
-0.032
pyyb
0.083
eef1da
-0.032
zgc:123297
0.082
gstz1
-0.032
ywhabl
0.082
si:ch211-14k19.8
-0.032
nptxrb
0.081
mylpfa
-0.032
BX088583.1
0.080
zgc:158463
-0.032
CU207281.2
0.078
pvalb2
-0.031
foxg1b
0.078
and2
-0.031
obscnb
0.078
CELA1 (1 of many)
-0.031
LOC101882251
0.077
col5a1
-0.031
atp5if1b
0.077
qdpra
-0.031
kmt5b
0.076
NC-002333.4
-0.030
LOC110437760
0.076
slc16a10
-0.030
ywhaz
0.075
tnni2a.4
-0.030